CoreLogic Reports 41,000 Completed Foreclosures in October
—Foreclosure inventory down 30.9 percent nationally from a year ago—
Completed foreclosures are an indication of the total number of homes actually lost to foreclosure. Since the financial crisis began in September 2008, there have been approximately 5.3 million completed foreclosures across the country, and since homeownership rates peaked in the second quarter of 2004, there have been approximately 7 million homes lost to foreclosure.
As of October 2014, approximately 605,000 homes nationally were in some stage of foreclosure, known as the foreclosure inventory, compared to 875,000 in October 2013, a year-over-year decrease of 30.9 percent and representing 36 consecutive months of year-over-year declines. The foreclosure inventory as of October 2014 made up 1.6 percent of all homes with a mortgage, compared to 2.2 percent in October 2013. On a month-over-month basis, the foreclosure inventory was down 2.1 percent from September 2014. The current foreclosure rate of 1.6 percent is the lowest inventory level since May 2008.
“While there has been a large improvement in the reduction of foreclosure inventory, completed foreclosures remain high and serve as one of the obstacles to new single-family construction,” said Sam Khater, deputy chief economist for CoreLogic. “Until the flow of completed foreclosures declines to normal levels, new-home construction will not pick up because builders have little incentive to compete with foreclosure stock.”
“The foreclosure inventory is less than 2 percent and seriously delinquent loans are trending lower right now,” said Anand Nallathambi, president and CEO of CoreLogic. “At current rates, we can expect the foreclosure inventory to slip below 500,000 units during 2015.”
Highlights as of October 2014:
- October represents 25 consecutive months of year-over-year double-digit declines in the inventory of foreclosed homes.
- All but one state and the District of Columbia posted double-digit declines in foreclosure inventory year over year; West Virginia saw a decline of only 8.9 percent, and the District of Columbia saw a 17.3 percent increase.
- Nineteen states showed declines in year-over-year foreclosure inventory of greater than 30 percent, with Florida (-44.9 percent) and Utah (-41.6 percent) experiencing the largest declines.
- The five states with the highest number of completed foreclosures for the 12 months ending in October 2014 were: Florida (118,000), Michigan (45,000), Texas (36,000), California (29,000) and Georgia (28,000). These five states accounted for almost half of all completed foreclosures nationally.
- Four states and the District of Columbia experienced the lowest number of completed foreclosures for the 12 months ending in October 2014: South Dakota (59), District of Columbia (70), North Dakota (257), West Virginia (515) and Wyoming (574).
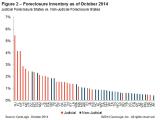
- The five states with the highest foreclosure inventory as a percentage of all mortgaged homes were: New Jersey (5.5 percent), Florida (4.1 percent), New York (4.1 percent), Hawaii (2.9 percent) and Maine (2.6 percent).
- The five states with the lowest foreclosure inventory as a percentage of all mortgaged homes were: Alaska (0.4 percent), Minnesota (0.5 percent), Nebraska (0.5 percent), North Dakota (0.5 percent) and Wyoming (0.5 percent).
*September data was revised. Revisions are standard, and to ensure accuracy, CoreLogic incorporates newly released data to provide updated results.
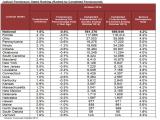
Judicial Foreclosure States Ranking (Ranked by Completed Foreclosures)
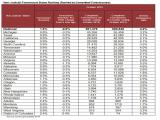
Non-Judicial Foreclosure States Ranking (Ranked by Completed Foreclosures)
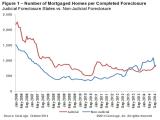
Figure 1: Number of Mortgaged Homes per Completed Foreclosure
Figure 2: Foreclosure Inventory as of October 2014
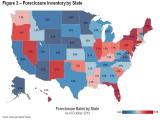
Figure 3: Foreclosure Inventory by State Map
For ongoing housing trends and data, visit the CoreLogic Insights Blog: http://www.corelogic.com/blog.
Methodology
The data in this report represents foreclosure activity reported through October 2014.
This report separates state data into judicial versus non-judicial foreclosure state categories. In judicial foreclosure states, lenders must provide evidence to the courts of delinquency in order to move a borrower into foreclosure. In non-judicial foreclosure states, lenders can issue notices of default directly to the borrower without court intervention. This is an important distinction since judicial states, as a rule, have longer foreclosure timelines, thus affecting foreclosure statistics.
A completed foreclosure occurs when a property is auctioned and results in the purchase of the home at auction by either a third party, such as an investor, or by the lender. If the home is purchased by the lender, it is moved into the lender’s real estate owned (REO) inventory. In “foreclosure by advertisement” states, a redemption period begins after the auction and runs for a statutory period, e.g., six months. During that period, the borrower may regain the foreclosed home by paying all amounts due as calculated under the statute. For purposes of this Foreclosure Report, because so few homes are actually redeemed following an auction, it is assumed that the foreclosure process ends in “foreclosure by advertisement” states at the completion of the auction.
The foreclosure inventory represents the number and share of mortgaged homes that have been placed into the process of foreclosure by the mortgage servicer. Mortgage servicers start the foreclosure process when the mortgage reaches a specific level of serious delinquency as dictated by the investor for the mortgage loan. Once a foreclosure is “started,” and absent the borrower paying all amounts necessary to halt the foreclosure, the home remains in foreclosure until the completed foreclosure results in the sale to a third party at auction or the home enters the lender’s REO inventory. The data in this report accounts for only first liens against a property and does not include secondary liens. The foreclosure inventory is measured only against homes that have an outstanding mortgage. Homes with no mortgage liens can never be in foreclosure and are, therefore, excluded from the analysis. Approximately one-third of homes nationally are owned outright and do not have a mortgage. CoreLogic has approximately 85 percent coverage of U.S. foreclosure data.
Source: CoreLogic
The data provided is for use only by the primary recipient or the primary recipient’s publication or broadcast. This data may not be re-sold, republished or licensed to any other source, including publications and sources owned by the primary recipient’s parent company without prior written permission from CoreLogic. Any CoreLogic data used for publication or broadcast, in whole or in part, must be sourced as coming from CoreLogic, a data and analytics company. For use with broadcast or web content, the citation must directly accompany first reference of the data. If the data is illustrated with maps, charts, graphs or other visual elements, the CoreLogic logo must be included on screen or website. For questions, analysis or interpretation of the data, contact Lori Guyton at [email protected] or Bill Campbell at [email protected]. Data provided may not be modified without the prior written permission of CoreLogic. Do not use the data in any unlawful manner. This data is compiled from public records, contributory databases and proprietary analytics, and its accuracy is dependent upon these sources.
About CoreLogic
CoreLogic (NYSE: CLGX) is a leading global property information, analytics and data-enabled services provider. The company’s combined data from public, contributory and proprietary sources includes over 3.5 billion records spanning more than 40 years, providing detailed coverage of property, mortgages and other encumbrances, consumer credit, tenancy, location, hazard risk and related performance information. The markets CoreLogic serves include real estate and mortgage finance, insurance, capital markets, and the public sector. CoreLogic delivers value to clients through unique data, analytics, workflow technology, advisory and managed services. Clients rely on CoreLogic to help identify and manage growth opportunities, improve performance and mitigate risk. Headquartered in Irvine, Calif., CoreLogic operates in North America, Western Europe and Asia Pacific. For more information, please visit www.corelogic.com.
CORELOGIC and the CoreLogic logo are trademarks of CoreLogic, Inc. and/or its subsidiaries.
For real estate industry and trade media:
Bill Campbell
[email protected]
212-995-8057
For general news media:
Lori Guyton
[email protected]
901-277-6066
# # #
Photo Gallery
-
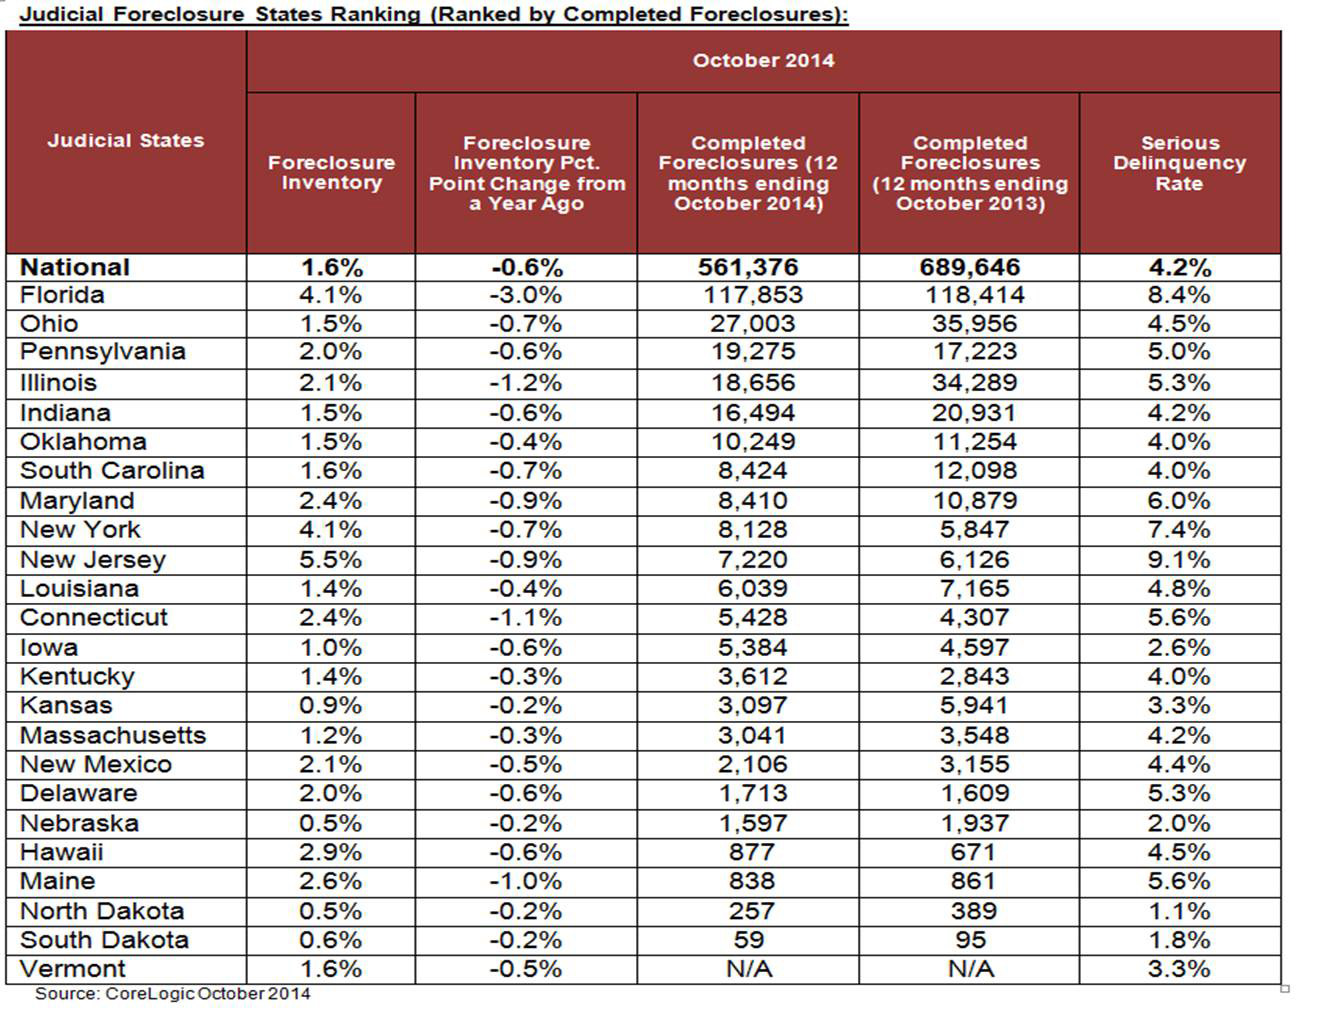
Judicial Foreclosure States Ranking (Ranked by Completed Foreclosures) -
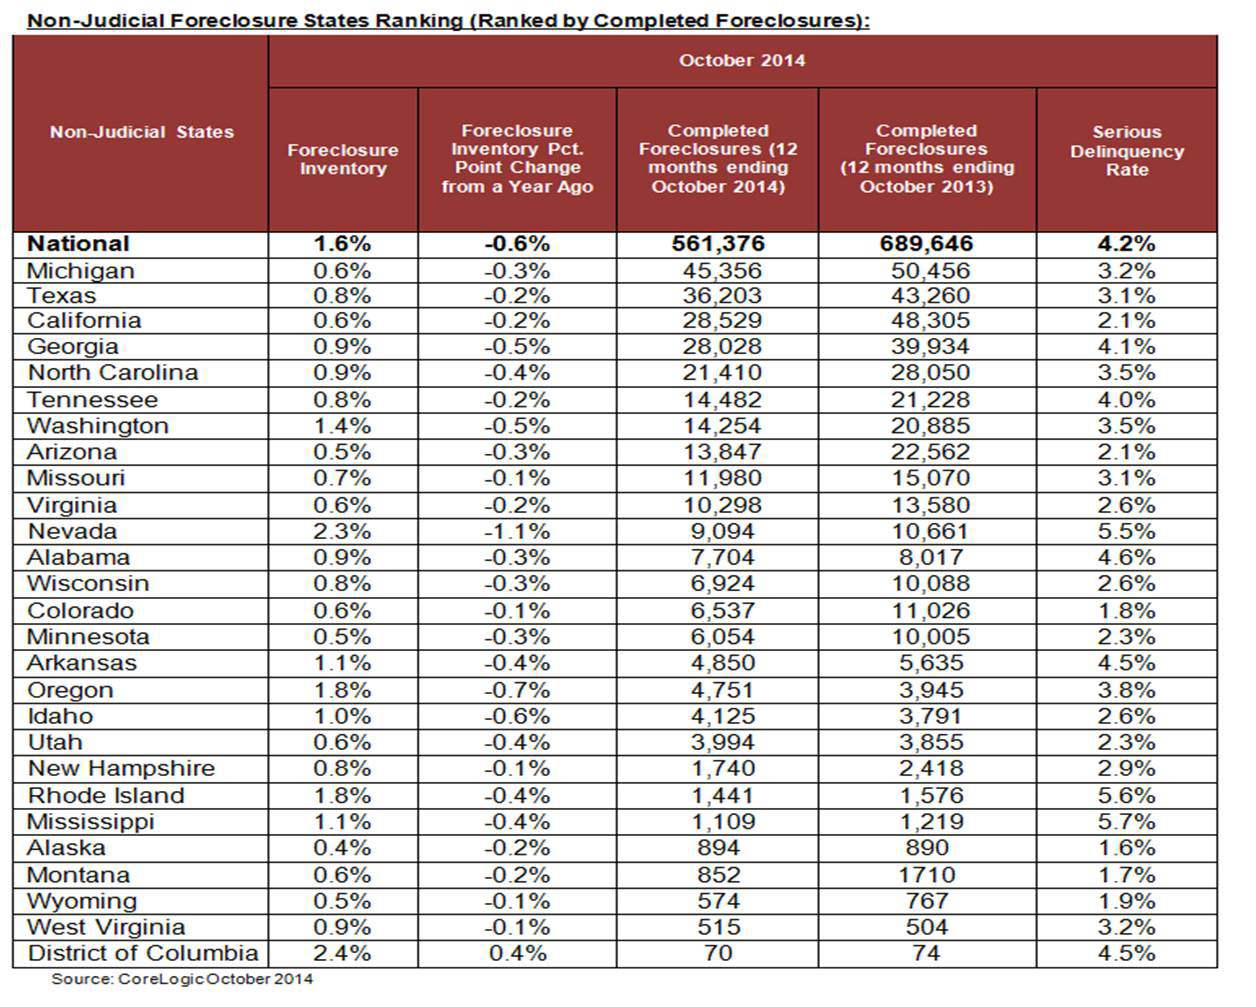
Non-Judicial Foreclosure States Ranking (Ranked by Completed Foreclosures) -
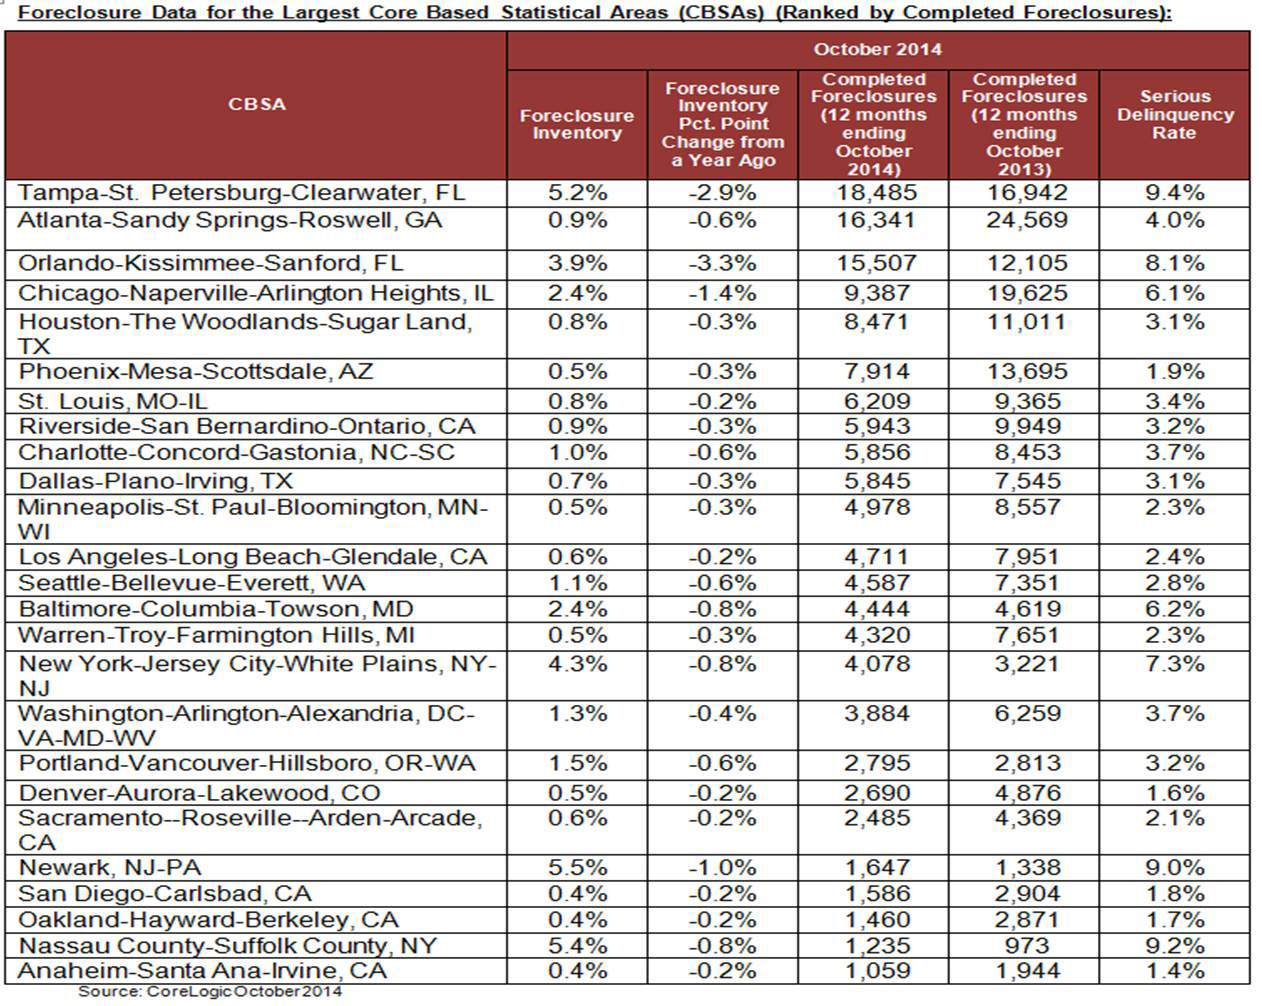
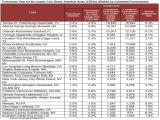
Foreclosure Data for the Largest Core Based Statistical Areas (CBSAs) (Ranked by Completed Foreclosures) -
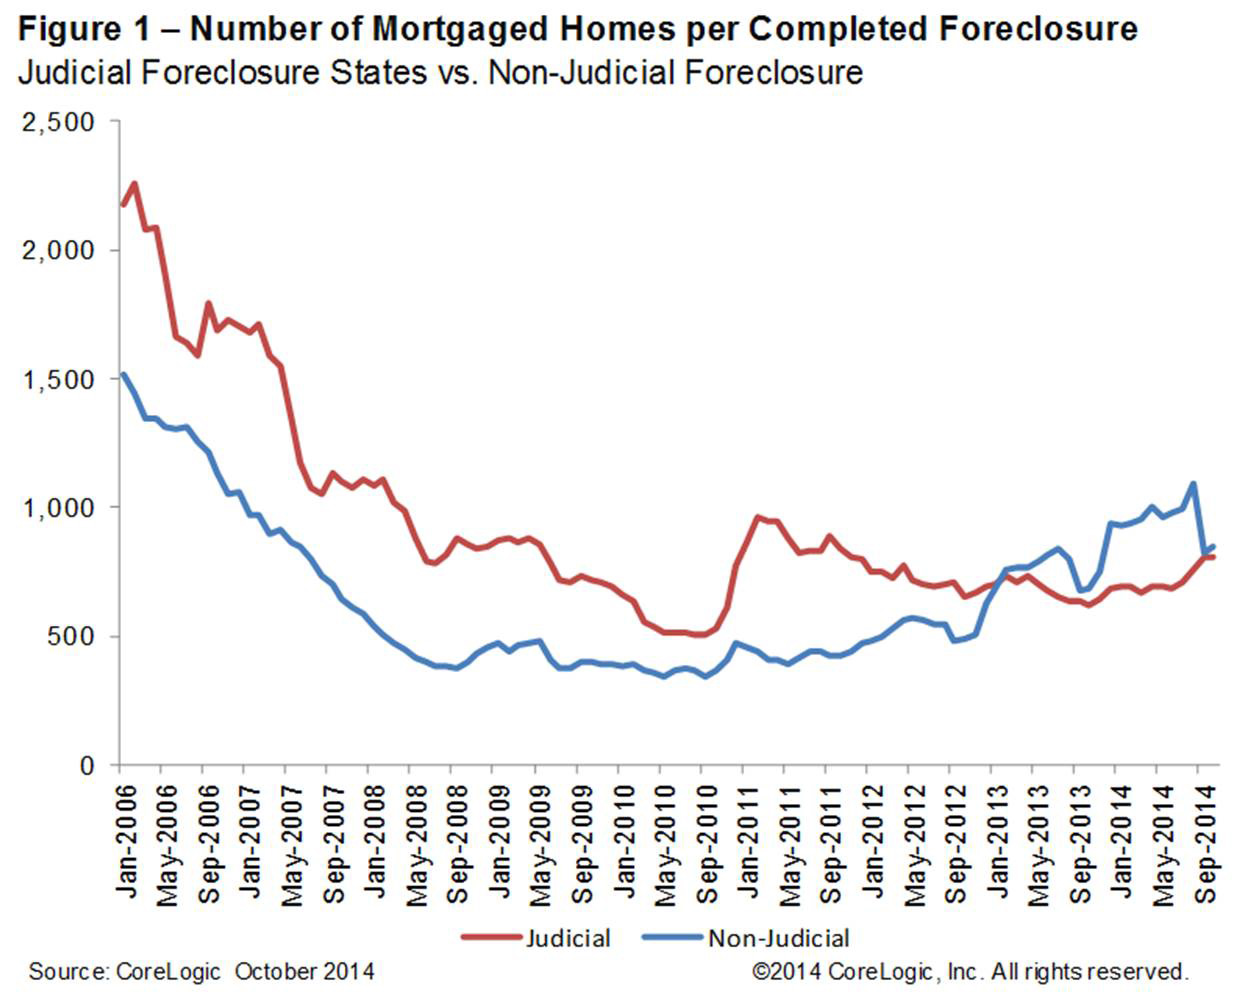
Figure 1: Number of Mortgaged Homes per Completed Foreclosure -
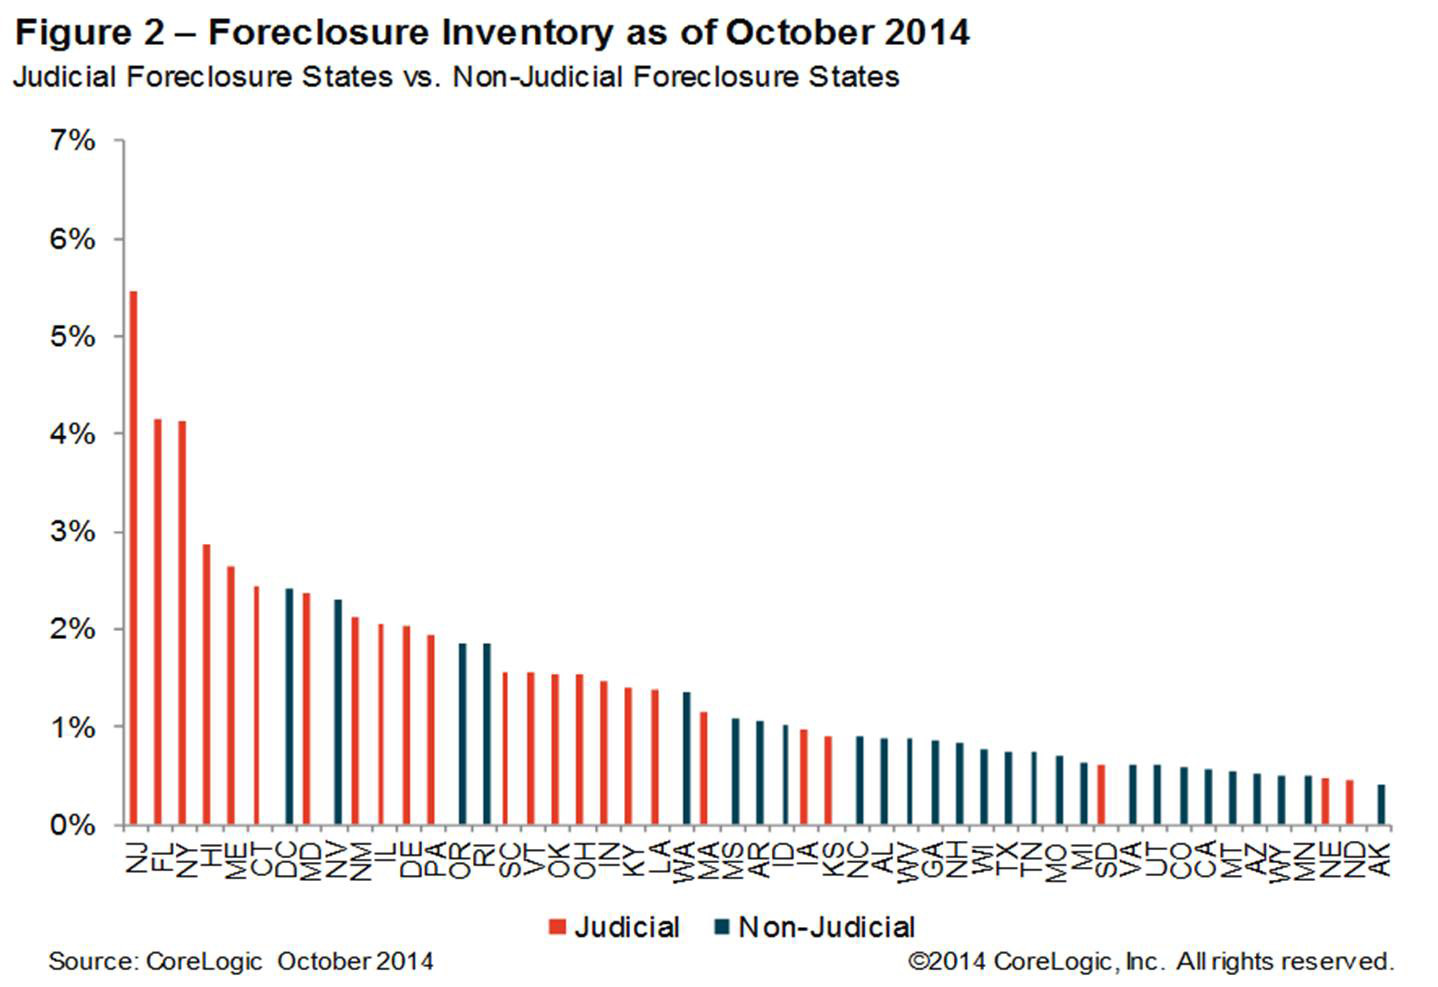
Figure 2: Foreclosure Inventory as of October 2014 -
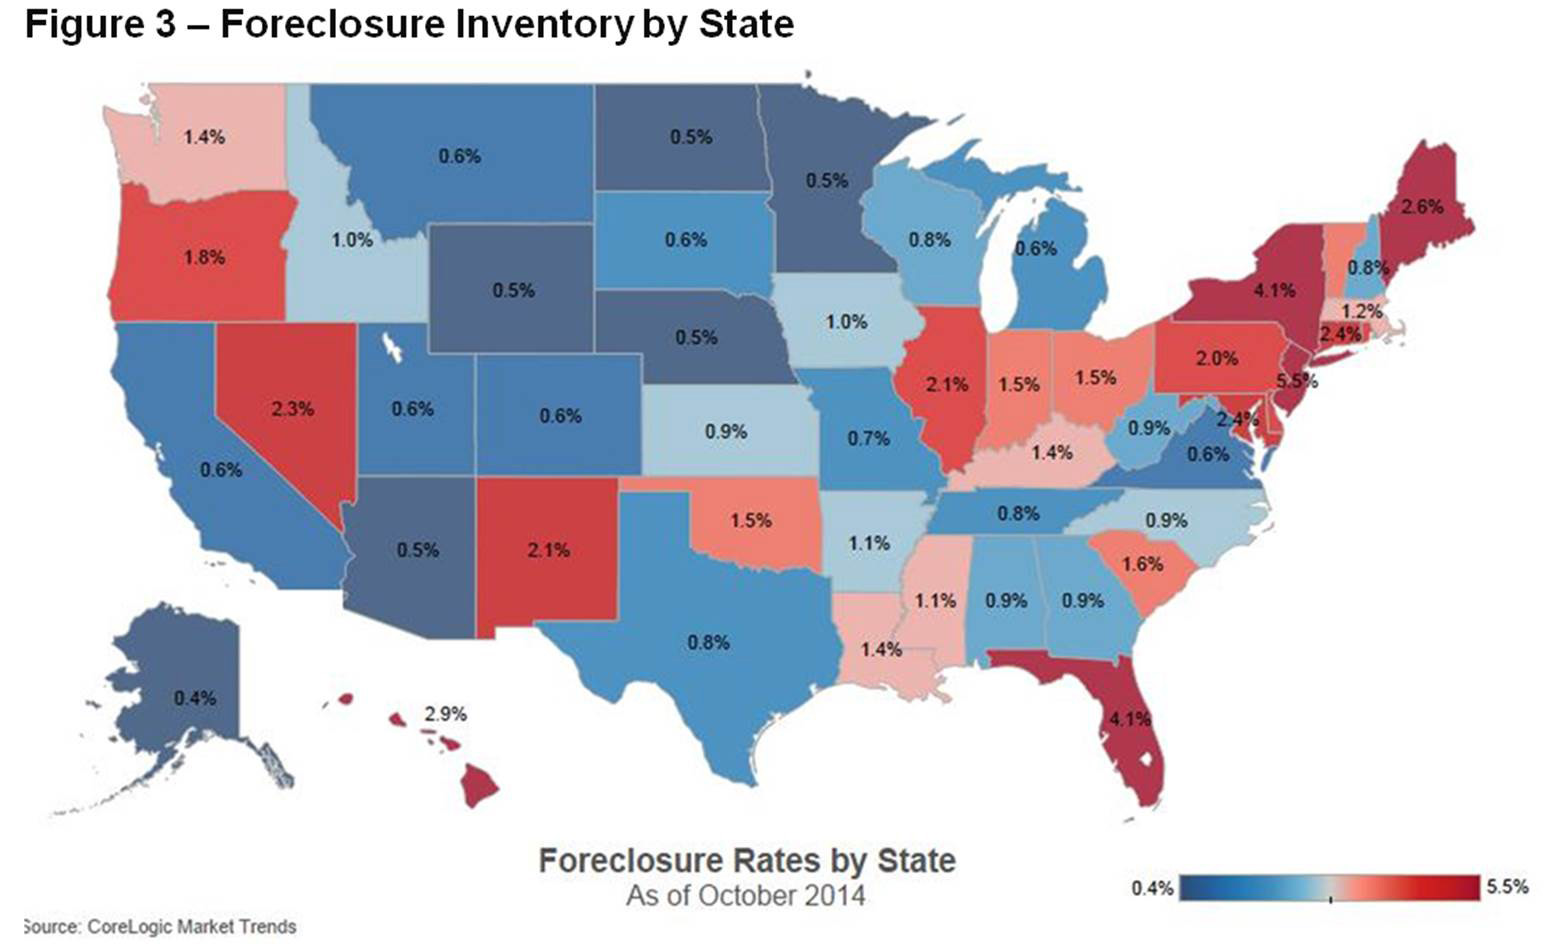
Figure 3: Foreclosure Inventory by State Map