CoreLogic Reports National Homes Prices Rose by 5.9 Percent Year Over Year in March 2015
—Home Prices Projected to Increase by 5.1 Percent Year Over Year by March 2016—
Including distressed sales in March, 27 states plus the District of Columbia were at or within 10 percent of their peak prices. Seven states, including Colorado, Nebraska, New York, Oklahoma, Tennessee, Texas and Wyoming, reached new home price highs since January 1976 when the CoreLogic HPI started.
Excluding distressed sales, home prices increased by 6.1 percent in March 2015 compared with March 2014 and increased by 2 percent month over month compared with February 2015. Excluding distressed sales, only New Mexico (0.4 percent) showed year-over-year depreciation in March. Distressed sales include short sales and real estate-owned (REO) transactions.
The CoreLogic HPI Forecast indicates that home prices, including distressed sales, are projected to increase by 0.8 percent month over month from March 2015 to April 2015 and on a year-over-year basis by 5.1 percent** from March 2015 to March 2016. Excluding distressed sales, home prices are expected to increase by 0.7 percent month over month from March 2015 to April 2015 and by 4.7 percent** year over year from March 2015 to March 2016. The CoreLogic HPI Forecast is a projection of home prices using the CoreLogic HPI and other economic variables. Values are derived from state-level forecasts by weighting indices according to the number of owner-occupied households for each state.
“The homes for sale inventory continues to be limited while buyer demand has picked up with low mortgage rates and improving consumer confidence,” said Frank Nothaft, chief economist for CoreLogic. “As a result, there has been continued upward pressure on prices in most markets, with our national monthly index up 2 percent for March 2015 and up approximately 6 percent from a year ago.”
“All signs are pointing toward continued price appreciation throughout 2015. In fact, the strong month-over-month gain in March may be a harbinger of accelerating price appreciation as we enter the spring selling season,” said Anand Nallathambi, president and CEO of CoreLogic. “Tight inventories, job growth and the inexorable impact of demographics and household formation are pushing price levels in many states, and especially large metropolitan areas like Dallas, Denver, Houston, Seattle and San Francisco, toward record levels.”
Highlights as of March 2015:
- Including distressed sales, the five states with the highest home price appreciation were: Colorado (+9.2 percent), South Carolina (+9.1 percent), Kansas (+8 percent), Texas (+8 percent) and Nevada (+7.6 percent).
- Excluding distressed sales, the five states with the highest home price appreciation were: Kansas (+9.5 percent), Colorado (+8.5 percent), South Carolina (+8.2 percent), Florida (+7.9 percent) and Texas (+7.6 percent).
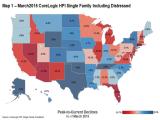
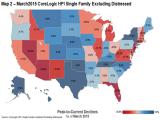
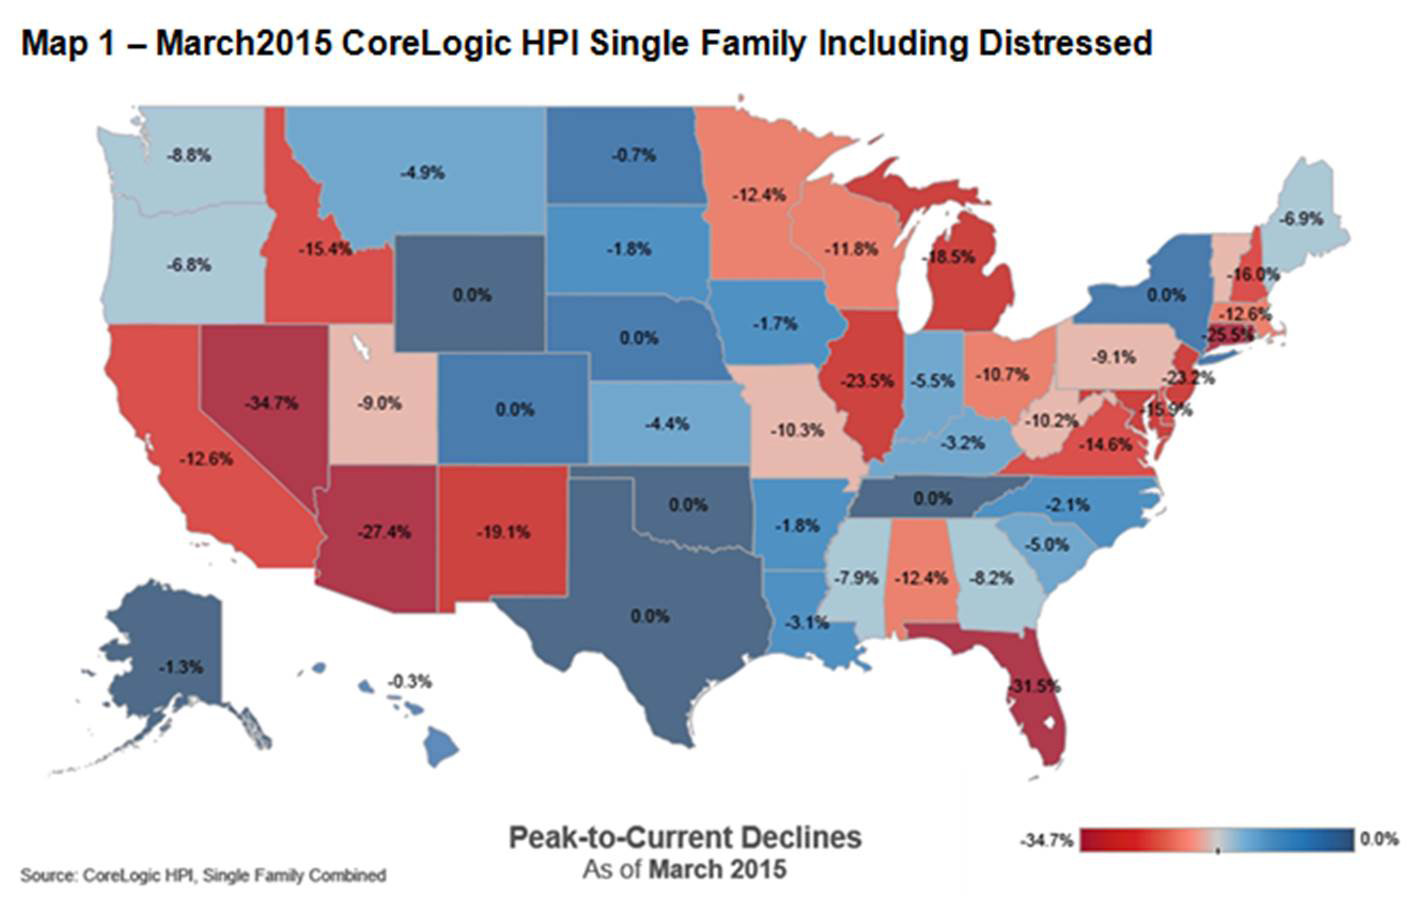
- Including distressed transactions, the peak-to-current change in the national HPI (from April 2006 to March 2015) was -11 percent. Excluding distressed transactions, the peak-to-current change for the same period was -6.7 percent.
- Including distressed sales, two states and the District of Columbia experienced home price depreciation at the following rates: Connecticut (-0.6 percent), the District of Columbia (-0.2 percent) and Maryland (-0.1 percent).
- The five states with the largest peak-to-current declines, including distressed transactions, were: Nevada (-34.7 percent), Florida (-31.5 percent), Rhode Island (-29 percent), Arizona (-27.4 percent) and Connecticut (-25.5 percent).
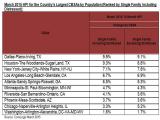
- Ninety of the top 100 Core Based Statistical Areas (CBSAs) measured by population showed year-over-year increases in March 2015. The 10 CBSAs that showed year-over-year declines were: Baltimore-Columbia-Towson, MD; Philadelphia, PA; Camden, NJ; Hartford-West Hartford-East Hartford, CT; New Orleans-Metairie, LA; Rochester, NY; Worcester, MA-CT.; Albany-Schenectady-Troy, NY; New Haven-Milford, CT and Wilmington, DE-MD-NJ.
*February data was revised. Revisions with public records data are standard, and to ensure accuracy, CoreLogic incorporates the newly released public data to provide updated results.
** The forecast accuracy represents a 95-percent statistical confidence interval with a +/- 2.0 percent margin of error for the index including distressed sales and a +/- 2.0 percent margin of error for the index excluding distressed sales.
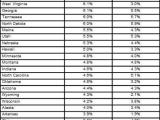
March National and State HPI (Ranked by Single Family Including Distressed)
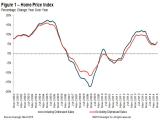
Figure 1: Home Price Index Percentage Change Year Over Year
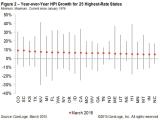
Figure 2: YoY HPI Growth for 25 Highest Rate States Min, Max, Current Since January 1976
Map 1 – March 2015 CoreLogic HPI Single-Family Combined Series Peak-to-Current Declines
Methodology
The CoreLogic HPI™ incorporates more than 30 years’ worth of repeat sales transactions, representing more than 65 million observations sourced from CoreLogic industry-leading property information and its securities and servicing databases. The CoreLogic HPI provides a multi-tier market evaluation based on price, time between sales, property type, loan type (conforming vs. nonconforming) and distressed sales. The CoreLogic HPI is a repeat-sales index that tracks increases and decreases in sales prices for the same homes over time, including single-family attached and single-family detached homes, which provides a more accurate “constant-quality” view of pricing trends than basing analysis on all home sales. The CoreLogic HPI provides the most comprehensive set of monthly home price indices available covering 7284 ZIP codes (59 percent of total U.S. population), 652 Core Based Statistical Areas (89 percent of total U.S. population) and 1,287 counties (86 percent of total U.S. population) located in all 50 states and the District of Columbia. Forecast ranges provided in this report are based on a 95 percent confidence interval.
Source: CoreLogic
The data provided are for use only by the primary recipient or the primary recipient's publication or broadcast. This data may not be resold, republished or licensed to any other source, including publications and sources owned by the primary recipient’s parent company without prior written permission from CoreLogic. Any CoreLogic data used for publication or broadcast, in whole or in part, must be sourced as coming from CoreLogic, a data and analytics company. For use with broadcast or web content, the citation must directly accompany first reference of the data. If the data are illustrated with maps, charts, graphs or other visual elements, the CoreLogic logo must be included on screen or website. For questions, analysis or interpretation of the data, contact Lori Guyton at [email protected] or Bill Campbell at [email protected]. Data provided may not be modified without the prior written permission of CoreLogic. Do not use the data in any unlawful manner. The data are compiled from public records, contributory databases and proprietary analytics, and its accuracy is dependent upon these sources.
About CoreLogic
CoreLogic (NYSE: CLGX) is a leading global property information, analytics and data-enabled services provider. The company's combined data from public, contributory and proprietary sources includes over 3.5 billion records spanning more than 40 years, providing detailed coverage of property, mortgages and other encumbrances, consumer credit, tenancy, location, hazard risk and related performance information. The markets CoreLogic serves include real estate and mortgage finance, insurance, capital markets, and the public sector. CoreLogic delivers value to clients through unique data, analytics, workflow technology, advisory and managed services. Clients rely on CoreLogic to help identify and manage growth opportunities, improve performance and mitigate risk. Headquartered in Irvine, Calif., CoreLogic operates in North America, Western Europe and Asia Pacific. For more information, please visit www.corelogic.com.
CORELOGIC, the CoreLogic logo, CoreLogic HPI, CoreLogic HPI Forecast and HPI are trademarks of CoreLogic, Inc. and/or its subsidiaries.
For real estate industry and trade media:
Bill Campbell
[email protected]
212-995-8057
For general news media:
Lori Guyton
[email protected]
901-277-6066
# # #
Photo Gallery
-
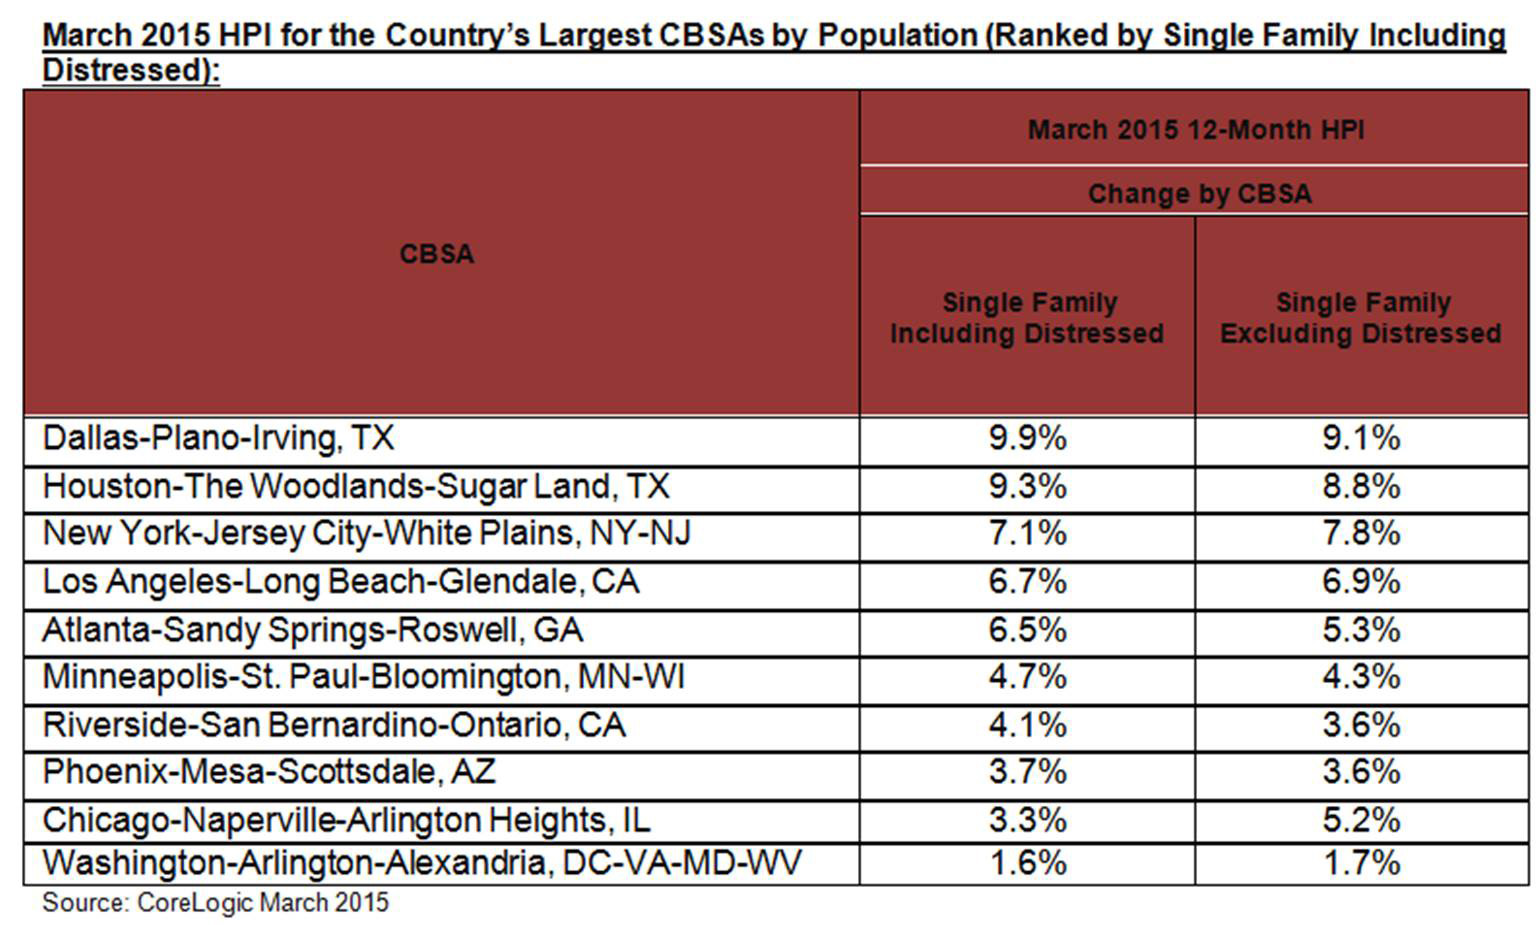
March HPI for the Country’s Largest CBSAs by Population (Ranked by Single Family Including Distressed) -
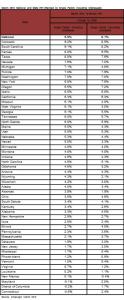
March National and State HPI (Ranked by Single Family Including Distressed) -
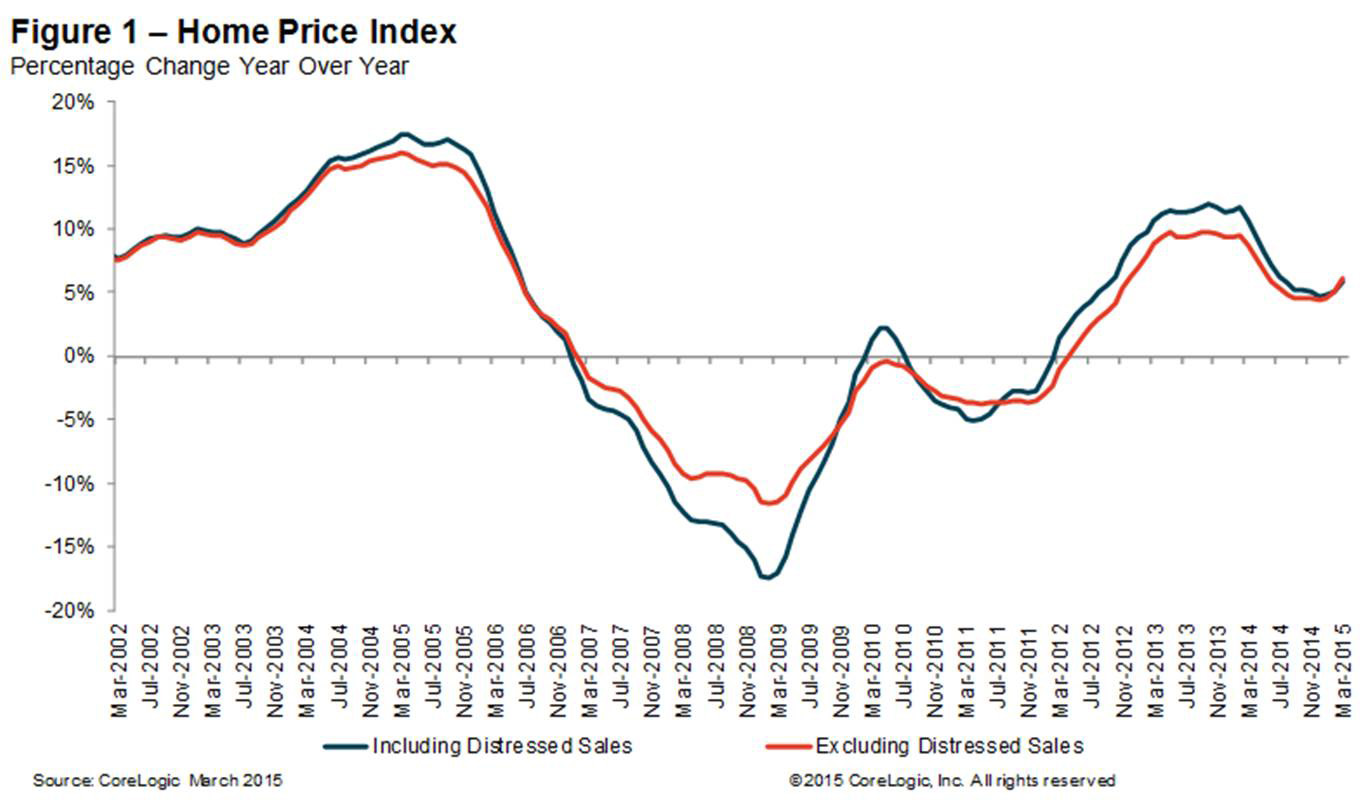
Figure 1: Home Price Index Percentage Change Year Over Year -
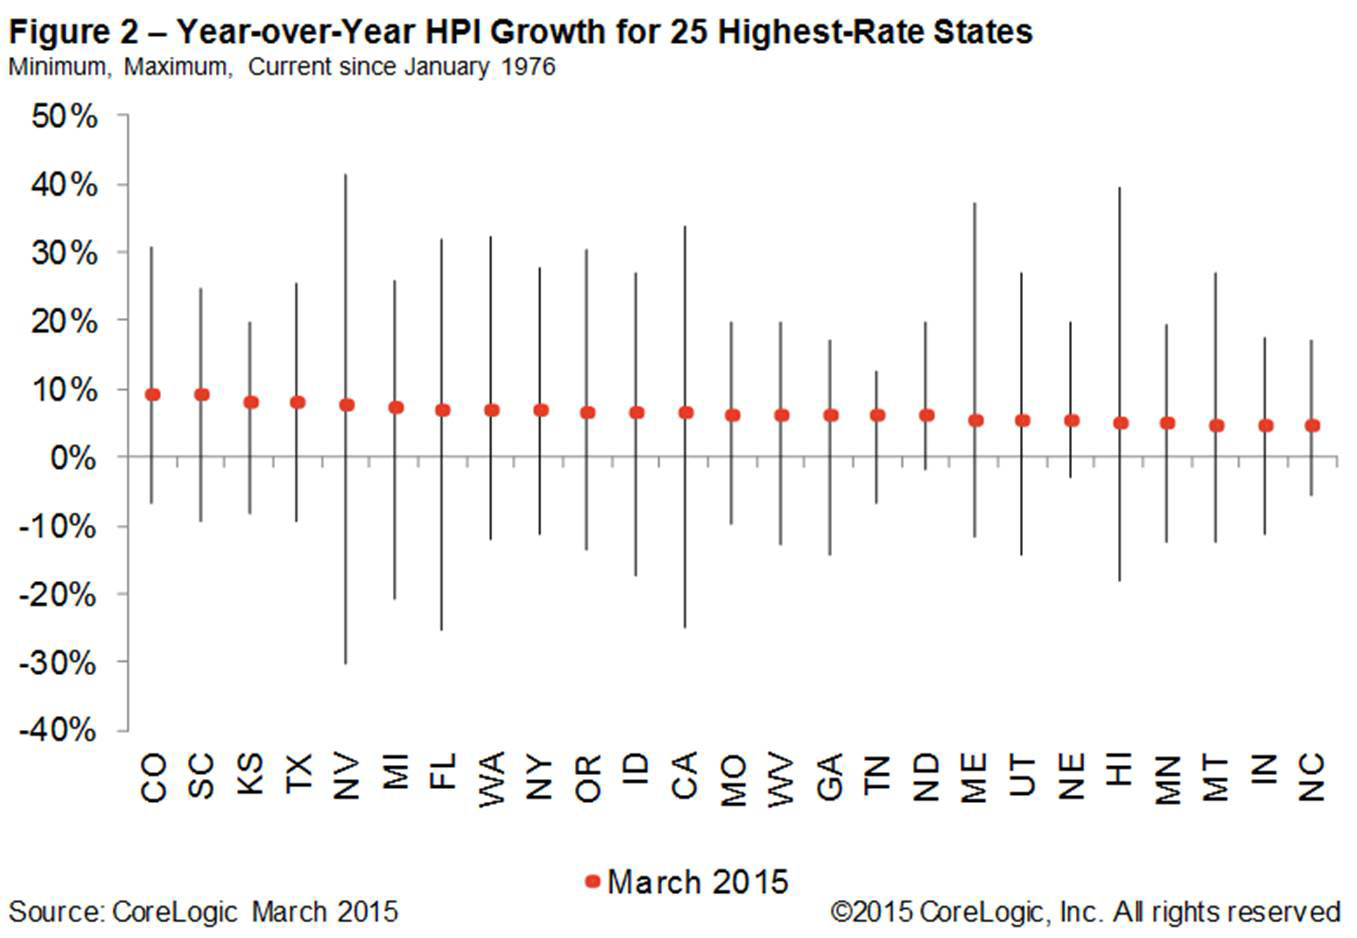
Figure 2: YoY HPI Growth for 25 Highest Rate States Min, Max, Current Since January 1976 -
Map 1 – March 2015 CoreLogic HPI Single-Family Combined Series Peak-to-Current Declines 12-Month Change by State -
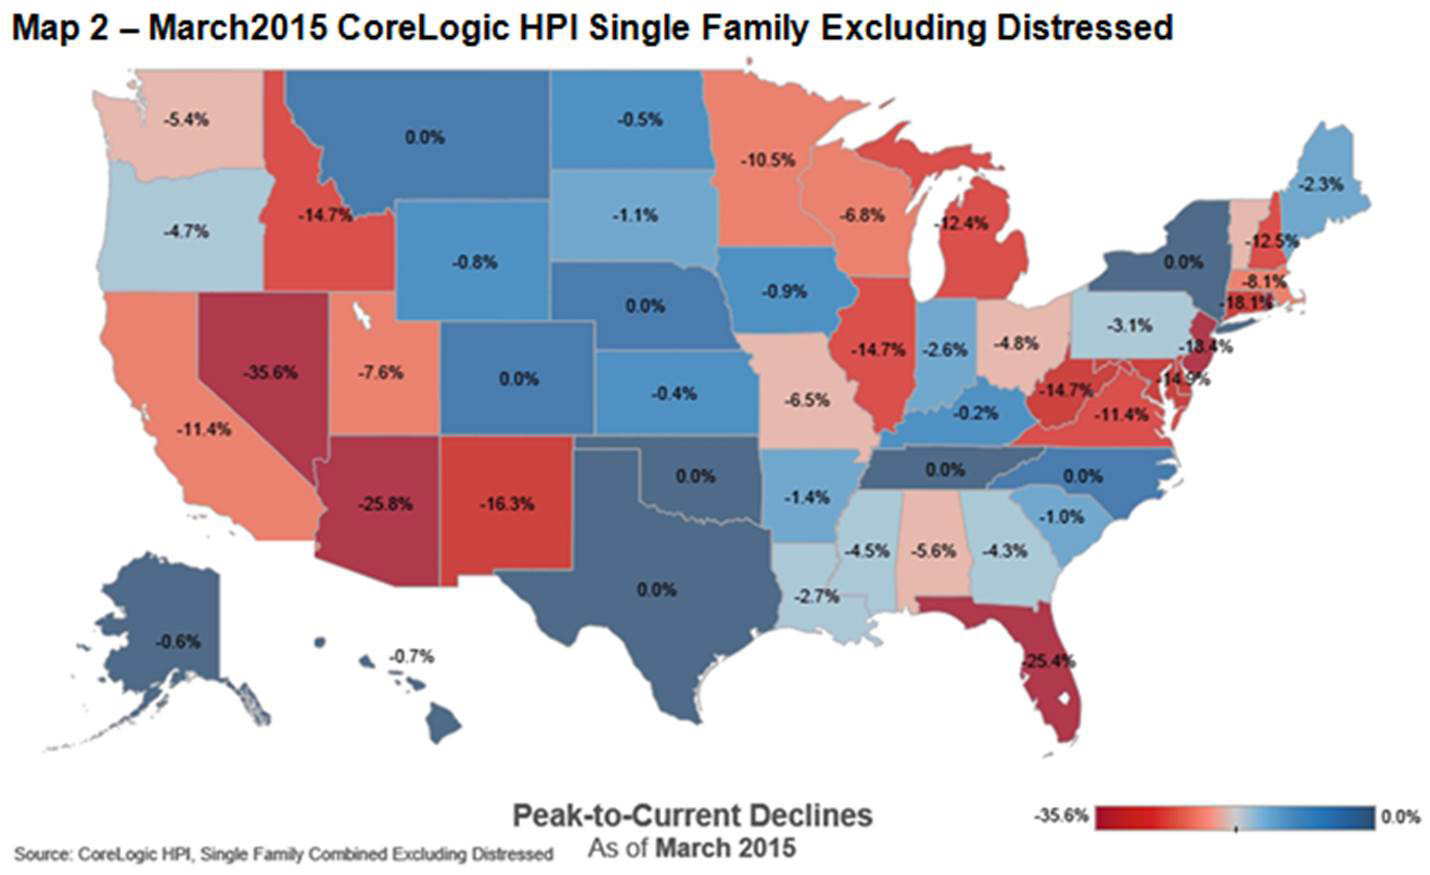
Map 2 – March 2015 Single-Family Combined Excluding Distressed Series Peak-to-Current Declines 12-Month Change by State