-
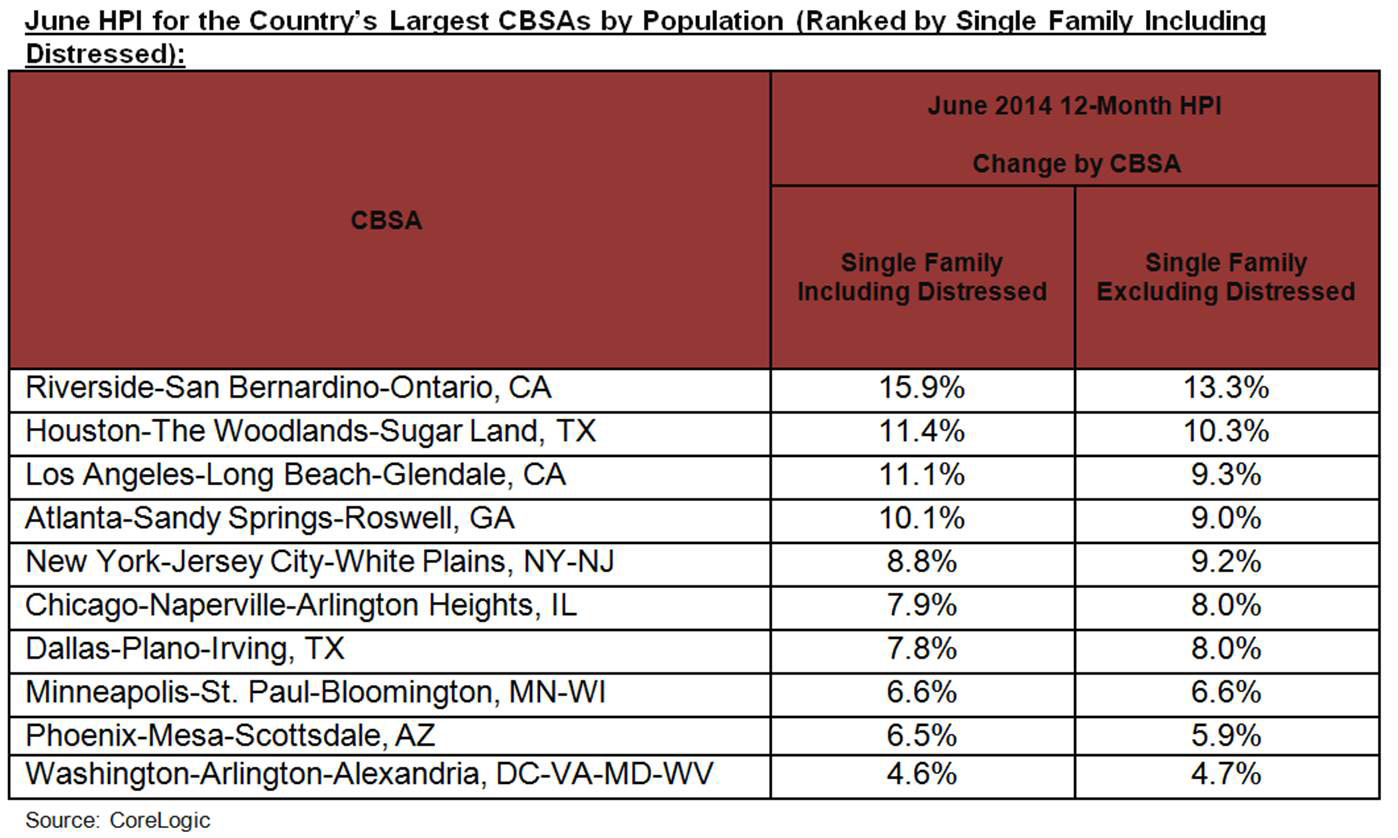
June HPI for the Country’s Largest CBSAs by Population (Ranked by Single Family Including Distressed) -
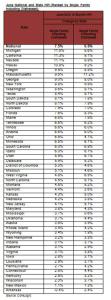
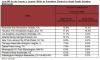
June National and State HPI (Ranked by Single Family Including Distressed) -
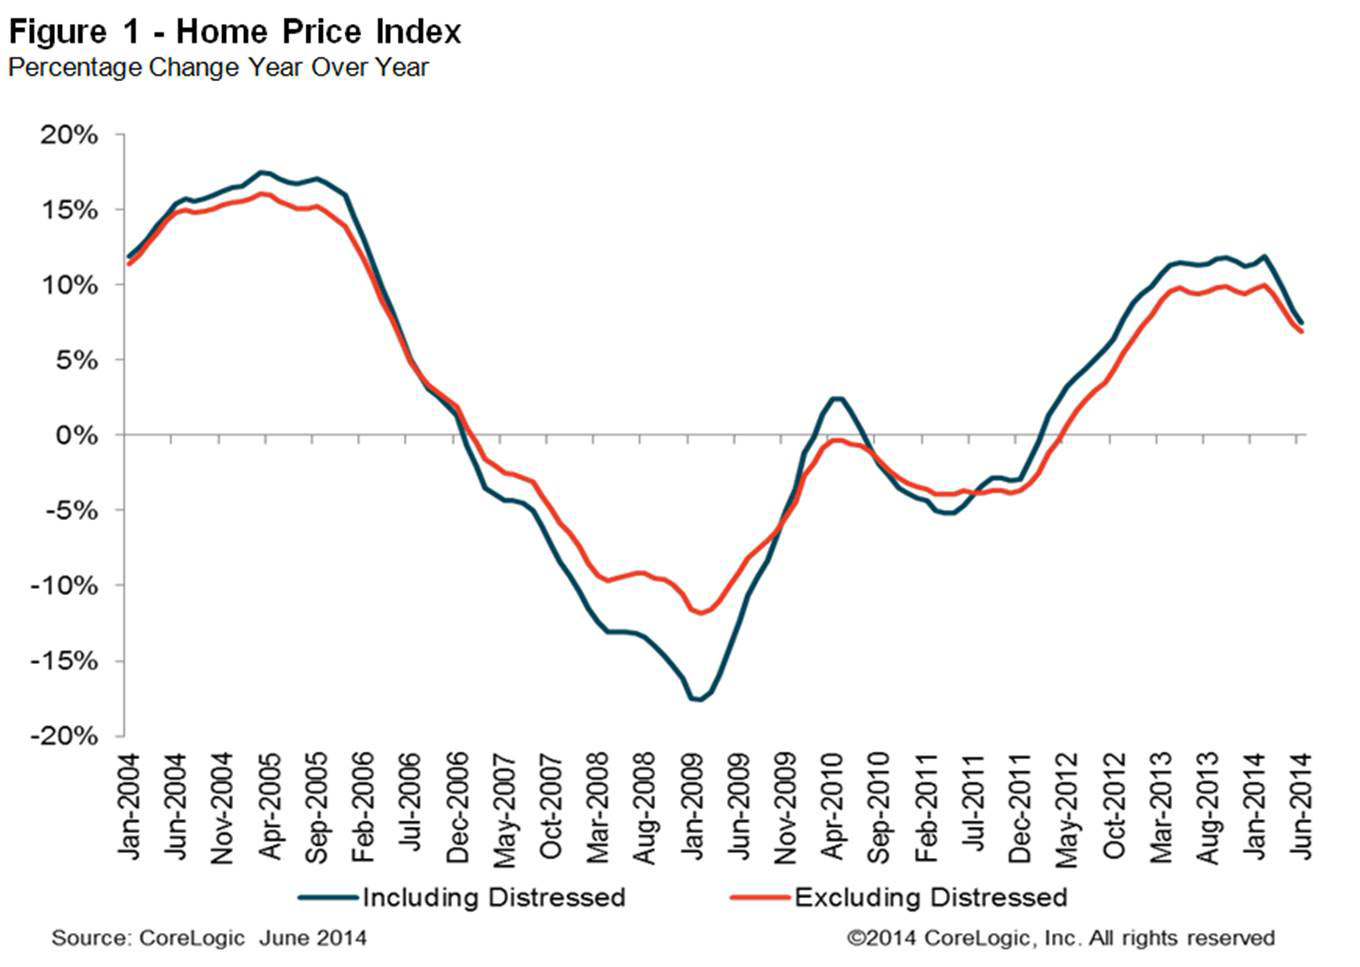
Figure 1: Home Price Index Percentage Change Year Over Year -
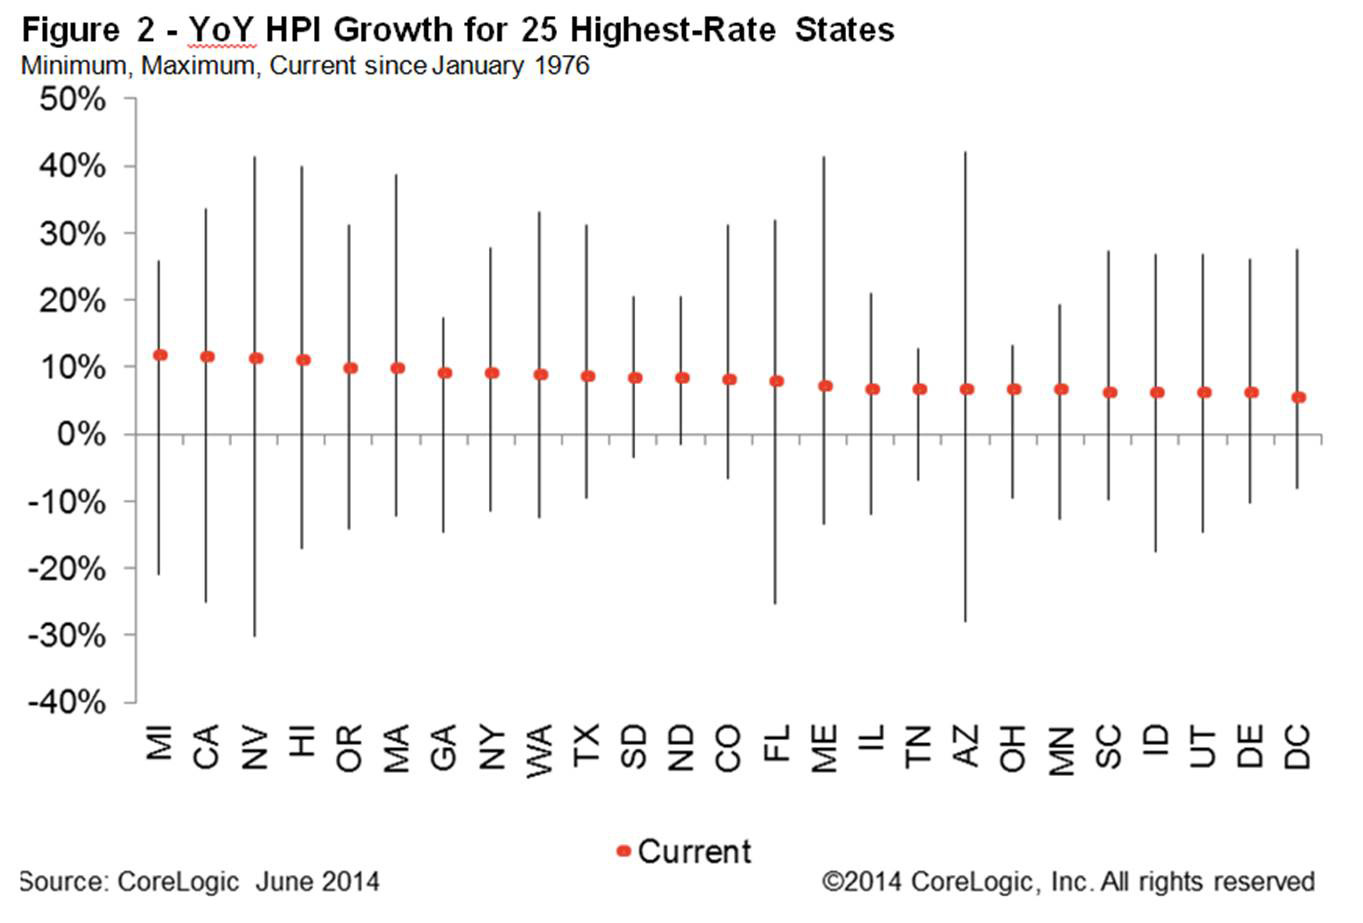
Figure 2: YoY HPI Growth for 25 Highest Rate States Min, Max, Current Since January 1976 -
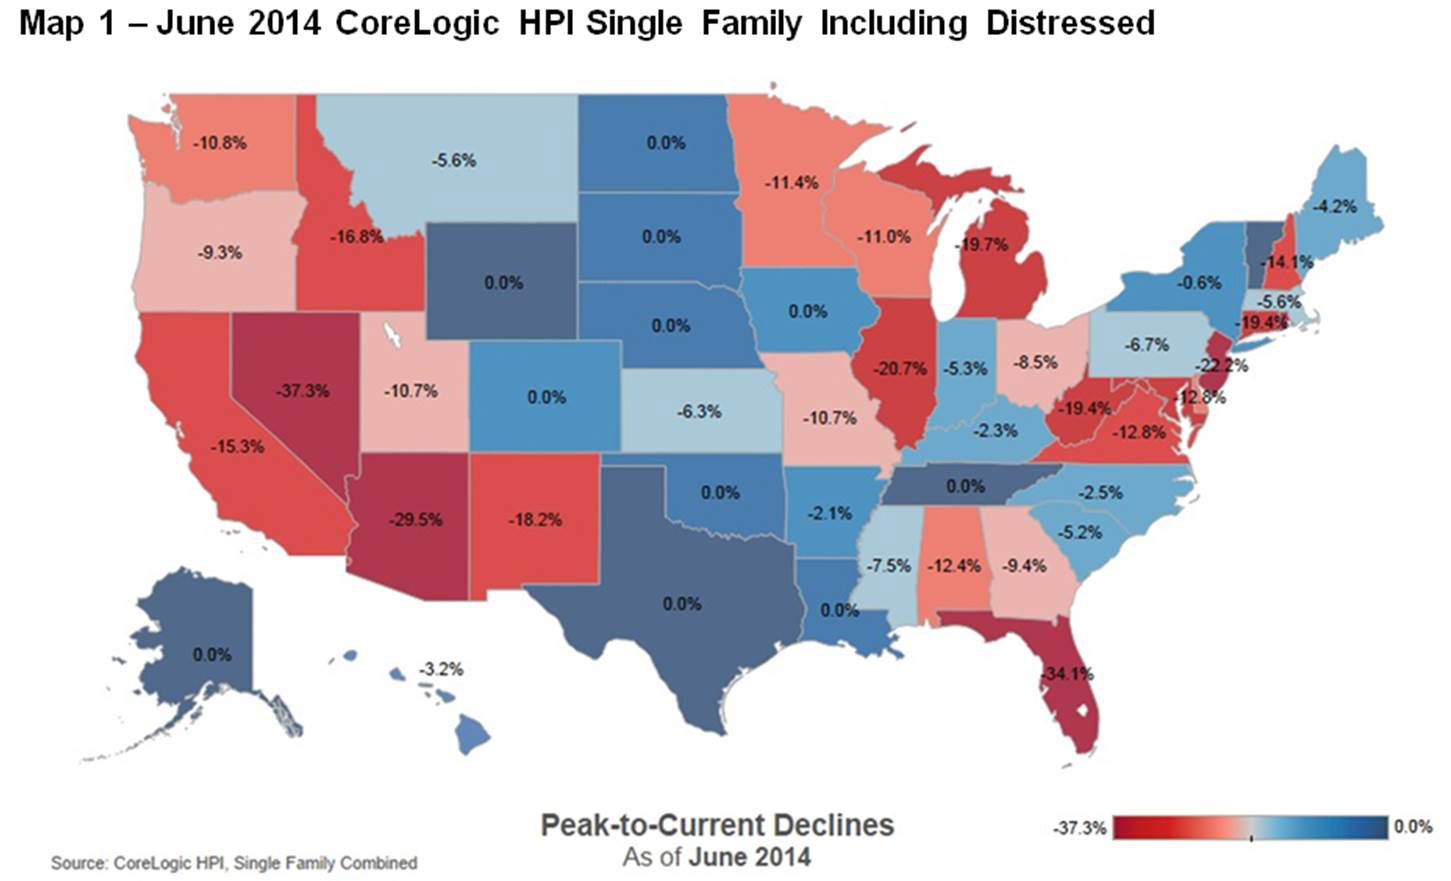
Map 1 – June 2014 CoreLogic HPI Single-Family Combined Series Peak to Current Declines 12-Month Change by State -
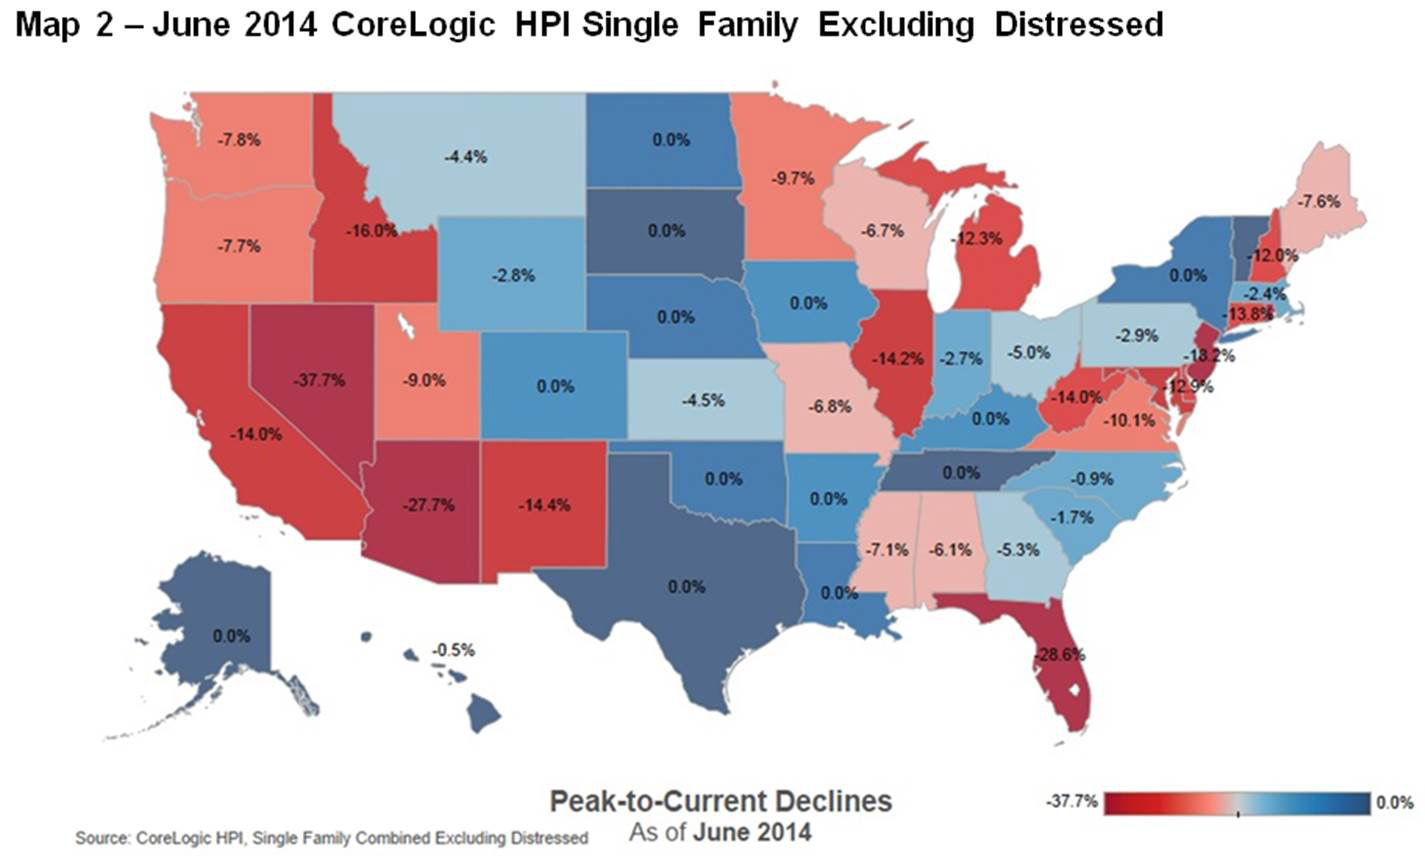
Map 2 – June 2014 Single-Family Combined Excluding Distressed Series Peak to Current Declines 12-Month Change by State