CoreLogic Reports 1.2 Million US Borrowers Regained Equity in 2014
—5.4 Million Properties Remain in Negative Equity as of Q4 2014—
Negative equity, often referred to as “underwater” or “upside down,” means that borrowers owe more on their mortgages than their homes are worth. Negative equity can occur because of a decline in value, an increase in mortgage debt or a combination of both.
For the homes in negative equity status, the national aggregate value of negative equity was $349 billion at the end of Q4 2014. Negative equity value increased approximately $7 billion from $341.8 billion in Q3 2014 to $348.8 billion in Q4 2014. On a year-over-year basis, however, the value of negative equity declined overall from $403 billion in Q4 2013, representing a decrease of 13.4 percent in 12 months.
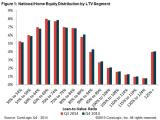
Of the 49.9 million residential properties with a mortgage, approximately 10 million, or 20 percent, have less than 20-percent equity (referred to as “under-equitied”) and 1.4 million of those have less than 5-percent equity (referred to as near-negative equity). Borrowers who are “under-equitied” may have a more difficult time refinancing their existing homes or obtaining new financing to sell and buy another home due to underwriting constraints. Borrowers with near-negative equity are considered at risk of moving into negative equity if home prices fall. In contrast, if home prices rose by as little as 5 percent, an additional 1 million homeowners now in negative equity would regain equity.
“The share of homeowners that had negative equity increased slightly in the fourth quarter of 2014, reflecting the typical weakness in home values during the final quarter of the year,” said Dr. Frank Nothaft, chief economist for CoreLogic. “Our CoreLogic HPI dipped 0.7 percent from September to December, and the percent of owners ‘underwater’ increased to 10.8 percent. However, from December-to-December, the CoreLogic index was up 4.8 percent, and the negative equity share fell by 2.6 percentage points.”
“Negative equity continued to be a serious issue for the housing market and the U.S. economy at the end of 2014 with 5.4 million homeowners still ‘underwater’,” said Anand Nallathambi, president and CEO of CoreLogic. “We expect the situation to improve over the course of 2015. We project that the CoreLogic Home Price Index will rise 5 percent in 2015, which will lift about 1 million homeowners out of negative equity.”
Highlights as of Q4 2014:
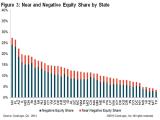
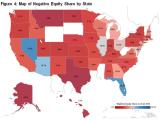
- Nevada had the highest percentage of mortgaged properties in negative equity at 24.2 percent; followed by Florida (23.2 percent); Arizona (18.7 percent); Illinois (16.2 percent) and Rhode Island (15.8 percent). These top five states combined account for 31.7 percent of negative equity in the United States.
- Texas had the highest percentage of mortgaged residential properties in an equity position at 97.4 percent, followed by Alaska (97.2 percent), Montana (97.0 percent), Hawaii (96.3 percent) and North Dakota (96.2 percent).
- Of the 25 largest Core Based Statistical Areas (CBSAs) based on mortgage count, Tampa-St. Petersburg-Clearwater, Fla., had the highest percentage of mortgaged properties in negative equity at 24.8 percent, followed by Phoenix-Mesa-Scottsdale, Ariz. (18.8 percent), Chicago-Naperville-Arlington Heights, Ill. (18.5 percent), Riverside-San Bernardino-Ontario, Calif. (14.8 percent) and Atlanta-Sandy Springs-Roswell, Ga. (14.6 percent).
- Of the same largest 25 CBSAs, Houston-The Woodlands-Sugar Land, Texas had the highest percentage of mortgaged properties in an equity position at 97.7 percent, followed by Dallas-Plano-Irving, TX (97.1 percent), Anaheim-Santa Ana-Irvine, Calif. (96.4 percent), Portland-Vancouver-Hillsboro, Ore. (96.4 percent) and Denver-Aurora-Lakewood, Col. (96.2 percent).
- Of the total $349 billion in negative equity, first liens without home equity loans accounted for $185 billion aggregate negative equity, while first liens with home equity loans accounted for $164 billion, or 47 percent.
- Approximately 3.2 million underwater borrowers hold first liens without home equity loans. The average mortgage balance for this group of borrowers is $228,000. The average underwater amount is $57,000.
- Approximately 2.1 million underwater borrowers hold both first and second liens. The average mortgage balance for this group of borrowers is $295,000.The average underwater amount is $77,000.
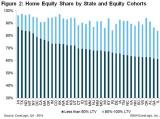
- The bulk of home equity for mortgaged properties is concentrated at the high end of the housing market. For example, 94 percent of homes valued at greater than $200,000 have equity compared with 84 percent of homes valued at less than $200,000.
*Q3 2014 data was revised. Revisions with public records data are standard, and to ensure accuracy, CoreLogic incorporates the newly released public data to provide updated results.
Figure 1: National Home Equity Distribution by LTV Segment
Figure 2: Home Equity Share by State and Equity Cohorts
Figure 3: Near-Negative and Negative Equity Share by State
Map 1: Map of Negative Equity Share by State
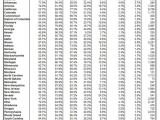
State Table: CoreLogic Q4 2014 Negative Equity by State*
*This data only includes properties with a mortgage. Non-mortgaged properties are by definition not included.
Methodology
The amount of equity for each property is determined by comparing the estimated current value of the property against the mortgage debt outstanding (MDO). If the MDO is greater than the estimated value, then the property is determined to be in a negative equity position. If the estimated value is greater than the MDO, then the property is determined to be in a positive equity position. The data is first generated at the property level and aggregated to higher levels of geography. CoreLogic data includes 49 million properties with a mortgage, which accounts for more than 85 percent of all mortgages in the U.S. CoreLogic uses its public record data as the source of the MDO, which includes both first-mortgage liens and second liens, and is adjusted for amortization and home equity utilization in order to capture the true level of MDO for each property. The calculations are not based on sampling, but rather on the full data set to avoid potential adverse selection due to sampling. The current value of the property is estimated using a suite of proprietary CoreLogic valuation techniques, including valuation models and the CoreLogic Home Price Index (HPI). Only data for mortgaged residential properties that have a current estimated value is included. There are several states or jurisdictions where the public record, current value or mortgage coverage is thin. These instances account for fewer than 5 percent of the total U.S. population.
Source: CoreLogic
The data provided is for use only by the primary recipient or the primary recipient’s publication or broadcast. This data may not be re-sold, republished or licensed to any other source, including publications and sources owned by the primary recipient’s parent company without prior written permission from CoreLogic. Any CoreLogic data used for publication or broadcast, in whole or in part, must be sourced as coming from CoreLogic, a data and analytics company. For use with broadcast or web content, the citation must directly accompany first reference of the data. If the data is illustrated with maps, charts, graphs or other visual elements, the CoreLogic logo must be included on screen or web site. For questions, analysis or interpretation of the data contact Lori Guyton at [email protected] or Bill Campbell at [email protected]. Data provided may not be modified without the prior written permission of CoreLogic. Do not use the data in any unlawful manner. This data is compiled from public records, contributory databases and proprietary analytics, and its accuracy depends upon these sources.
About CoreLogic
CoreLogic (NYSE: CLGX) is a leading global property information, analytics and data-enabled services provider. The company’s combined data from public, contributory and proprietary sources includes over 3.5 billion records spanning more than 40 years, providing detailed coverage of property, mortgages and other encumbrances, consumer credit, tenancy, location, hazard risk and related performance information. The markets CoreLogic serves include real estate and mortgage finance, insurance, capital markets, and the public sector. CoreLogic delivers value to clients through unique data, analytics, workflow technology, advisory and managed services. Clients rely on CoreLogic to help identify and manage growth opportunities, improve performance and mitigate risk. Headquartered in Irvine, Calif., CoreLogic operates in North America, Western Europe and Asia Pacific. For more information, please visit www.corelogic.com.
CORELOGIC and the CoreLogic logo are trademarks of CoreLogic, Inc. and/or its subsidiaries.
# # #
For real estate industry and trade media:Bill Campbell
[email protected]
212-995-8057
For general news media:
Andrea Hurst
[email protected]
405-487-7721
Photo Gallery
-
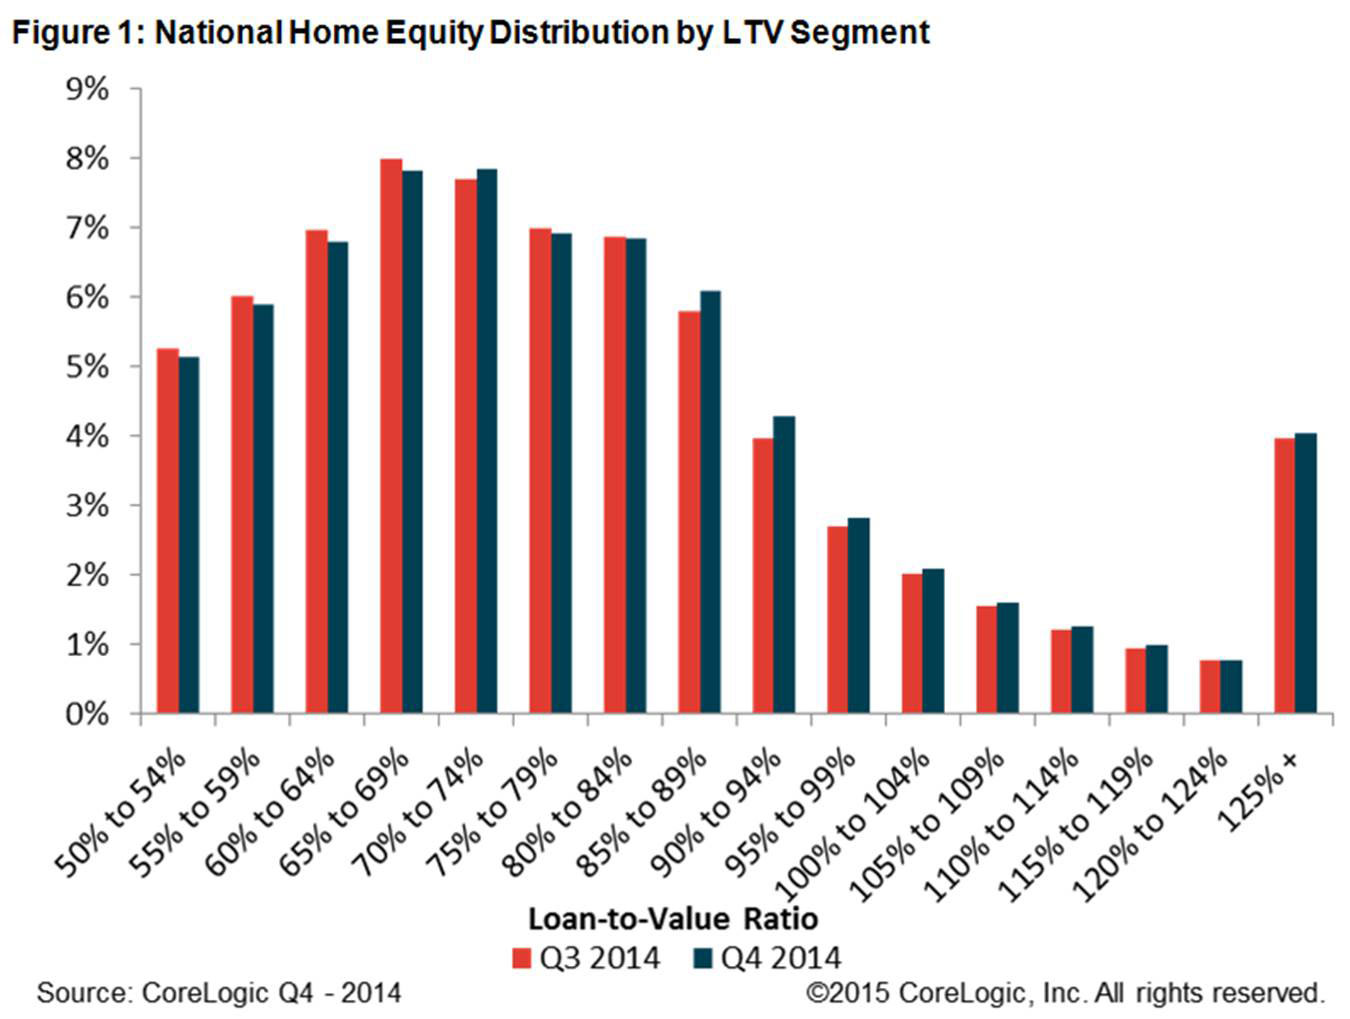
Figure 1: National Home Equity Distribution by LTV Segment -
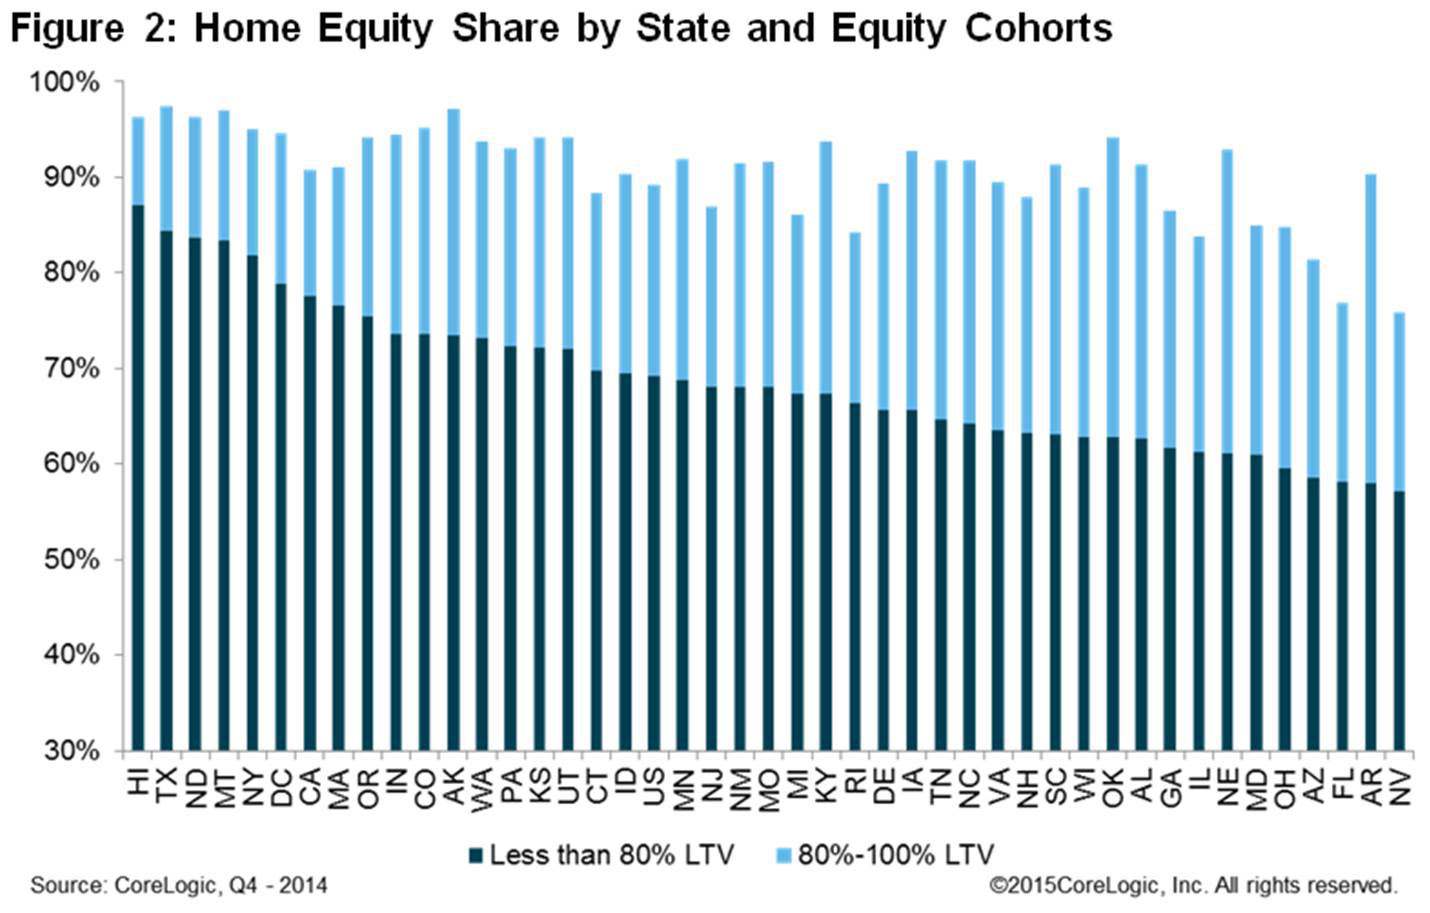
Figure 2: Home Equity Share by State and Equity Cohorts -
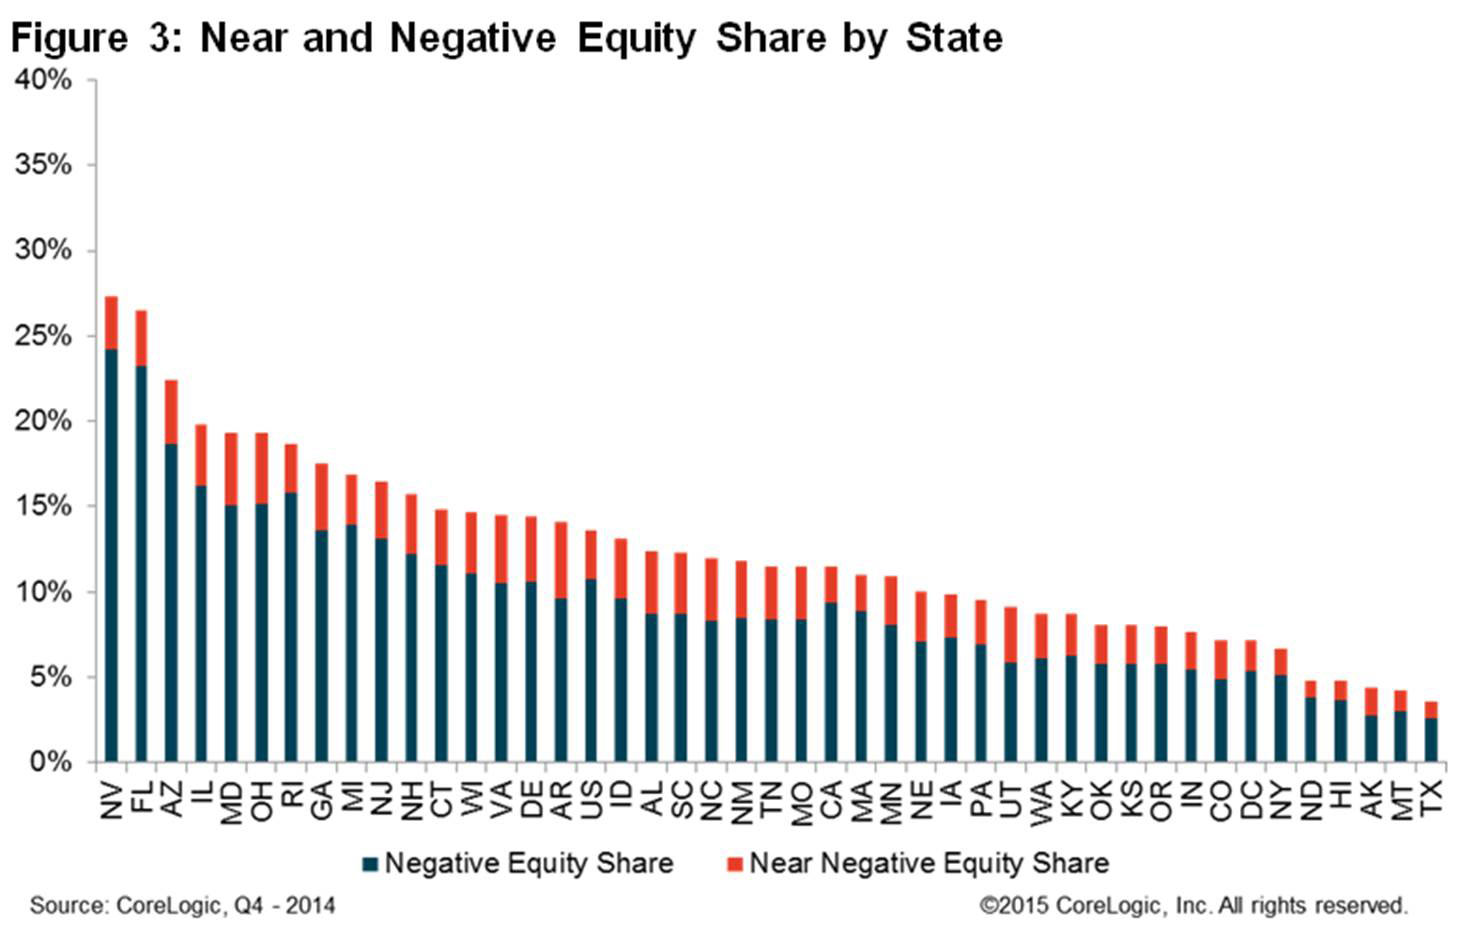
Figure 3: Near-Negative and Negative Equity Share by State -
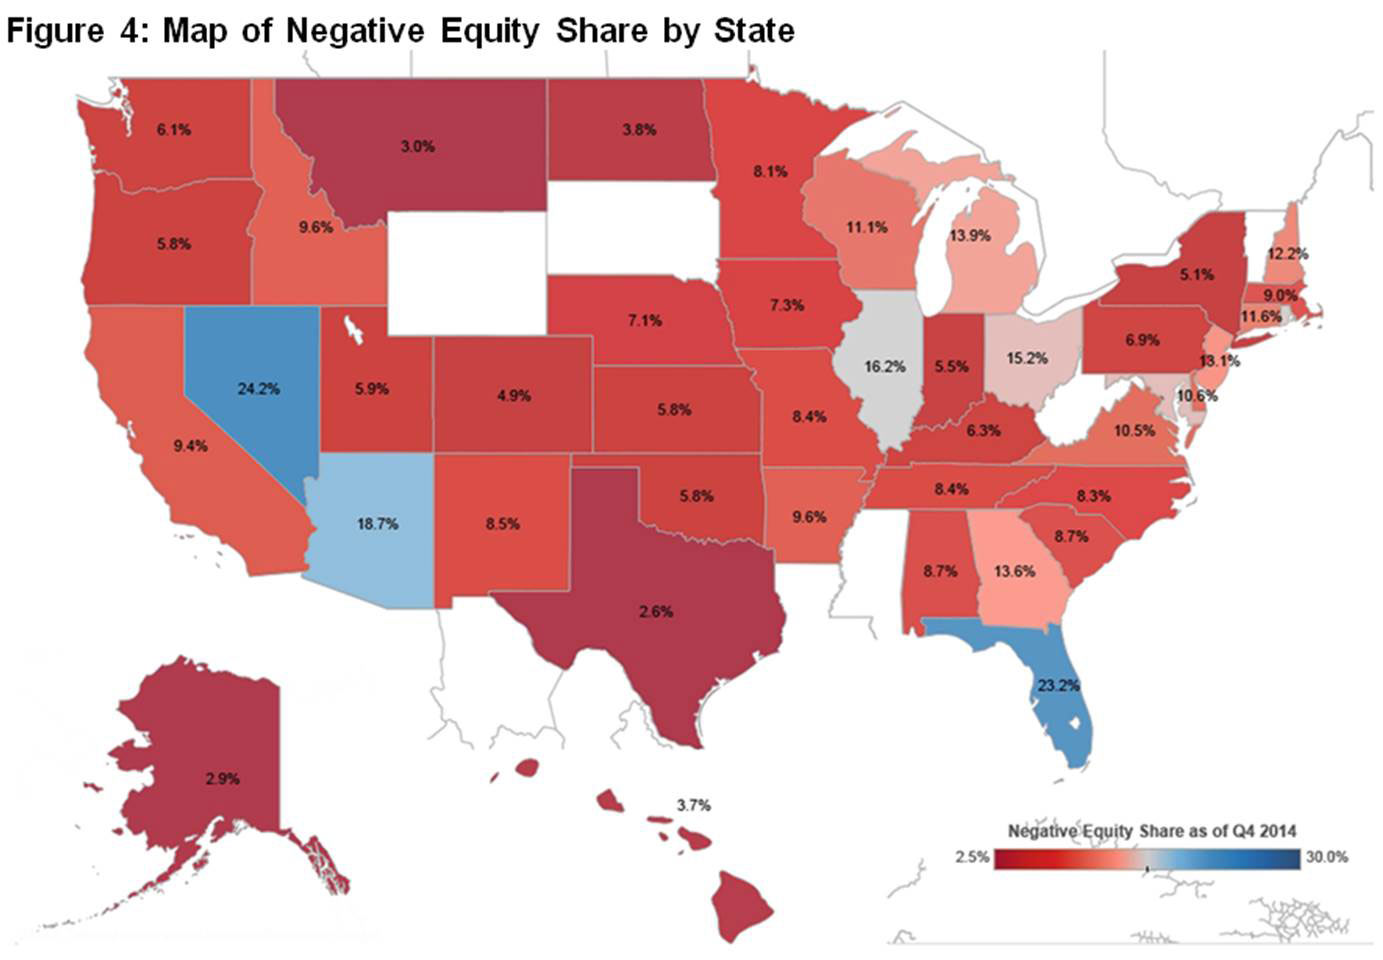
Map 1: Map of Negative Equity Share by State -
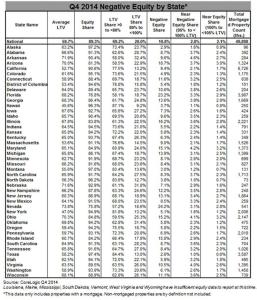
State Table: CoreLogic Q4 2014 Negative Equity by State* *This data only includes properties with a mortgage. Non-mortgaged properties are by definition not included.