Data … and Broadcast Media???

Data. It’s one hot topic. It’s not just for financial institutions and the tech world anymore. Behind every single industry sits a ton of data. The interesting and fun part is taking the information, making sense of it and then making it easy for clients to understand (and making it look pretty doesn’t hurt either).
In the media space, data is collected and used daily. Digital media leaves a trail, which makes it easy to collect the information you need. This is the entire purpose of programs such as Google Analytics: to track and report website traffic.
Since the utilization of data to measure ROI is so widely popular, it’s more important than ever to analyze multiple data sets when reporting on broadcast media campaigns. But how do you use that data to interact with your clients and stand out when it comes to displaying broadcast campaign results?
Figure Out What You’re Looking For
It can be challenging to search and collect data from television and/or radio advertising. Many times there just isn’t a link or tracking placed on a file. As a broadcast data analyst, you may need to be more hands-on and creative when collecting the necessary data. Get ready to dig!
You first need to decide what to search for. Are you searching coverage surrounding a certain spokesperson…for a product…or possibly for a new drug that was just approved by the FDA? Once you have your search terms figured out, you can begin tracking coverage. By using a media monitoring site you can search through selected data and create a results report.
What Does the Raw Data Look Like
Let’s use a television campaign as an example. If a B-roll piece about safe holiday travel is fed out to affiliates, you may collect many airing results. Each result is going to give you the same information. The raw data will consist of a television station, the station location, date and time of the airing, length, and an audience figure. One of the best ways to keep track of this kind of data is by using Excel. In order to examine results like this, separating it into rows and columns is very helpful. The only thing is, raw data isn’t pretty. It can be boring and confusing, and no one wants to send or receive campaign results that aren’t appealing.
Use Compelling Content to Interact with Customers
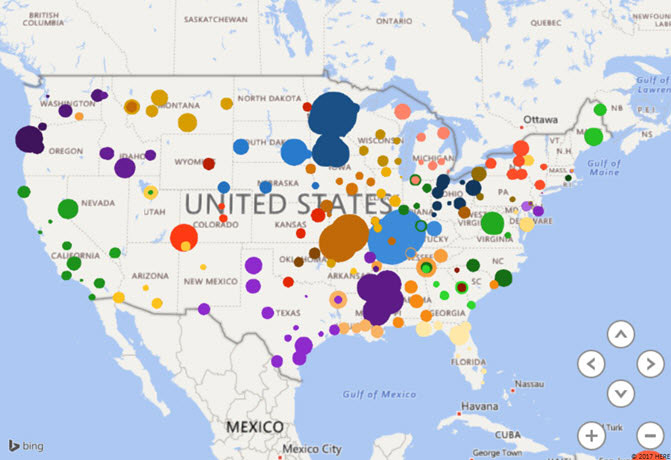
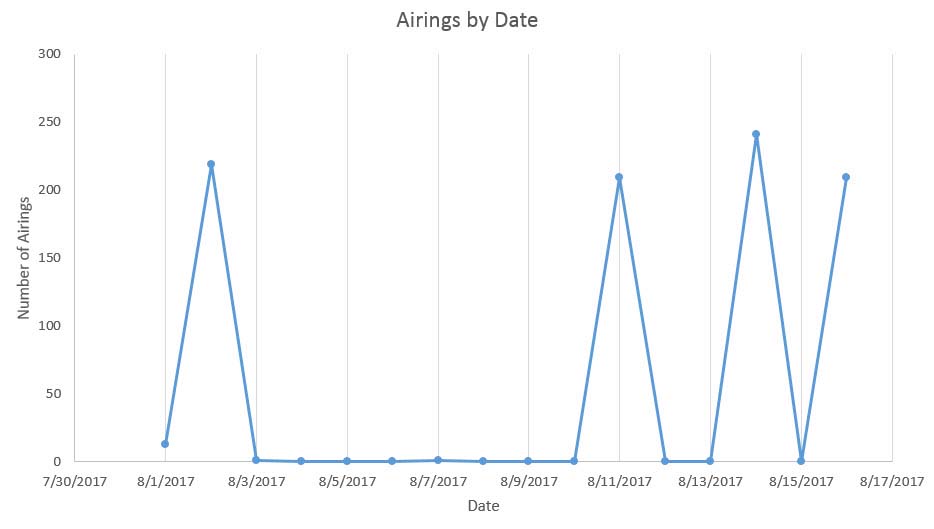
Here is where it gets even more fun. You get to choose how you want to display the data to your customers. I’ve found that the best way to do this is to split up text and/or numbers with color (such as graphs, maps, and infographics). If it’s important for customers to see airing coverage visually, incorporating a map in your results report is a great way to accomplish that. Maybe it’s also important to show how many of the airings took place during the first week after the launch.
Below are examples of both:
This map illustrates television and radio coverage across America. The size of the circles represent the amount of coverage in the market. The larger the circle, the more coverage.

This graph shows what days during the campaign garnered the most airings.

To really engage your customer, include anything that customers can watch, listen or click on. This is very important when compiling a broadcast data report. It’s one thing to say that content aired on a certain station at a certain time, but if there’s a video link to go along with that information, it only adds to the credibility of the hit.
Being someone who gets excited when I figure out a new formula in Excel, I’m lucky that data is all around us. Here’s to another year and finding new ways to engage with our MultiVu customers and keep them excited about their broadcast campaign results. Show me the data, 2018!
ABOUT THE EXPERT: Amanda Becker
Amanda Becker, Senior Broadcast Reporting Analyst, MultiVu. Amanda started her career in local news reporting. She landed her first job as a court and crime reporter for Capital Newspapers in Madison, WI. Eight years ago, Amanda moved to New York City and began her career in broadcast public relations with MultiVu. She analyzes data, loves working with Excel and creating fancy campaign reports for clients. Amanda works on all broadcast projects, including: Satellite Media Tours, B-Roll, PSA’s, and Audio News Releases.
Amanda graduated from the University of Wisconsin-Madison with a B.A. in Journalism and Mass Communication. Go Badgers!
About MultiVu
MultiVu, a Cision/PR Newswire division, produces and places compelling content strategically across multiple channels globally to deliver targeted results and drive desired engagement. Created in 2002 from network news veterans and media relations professionals, MultiVu has grown into a content creation and media strategy company, leading in the broadcast communications industry. More information can be found on www.multivu.com.


